Bitcoin spent October going nowhere. The entire month delivered just 1.5% gains while traders waited for something to happen.
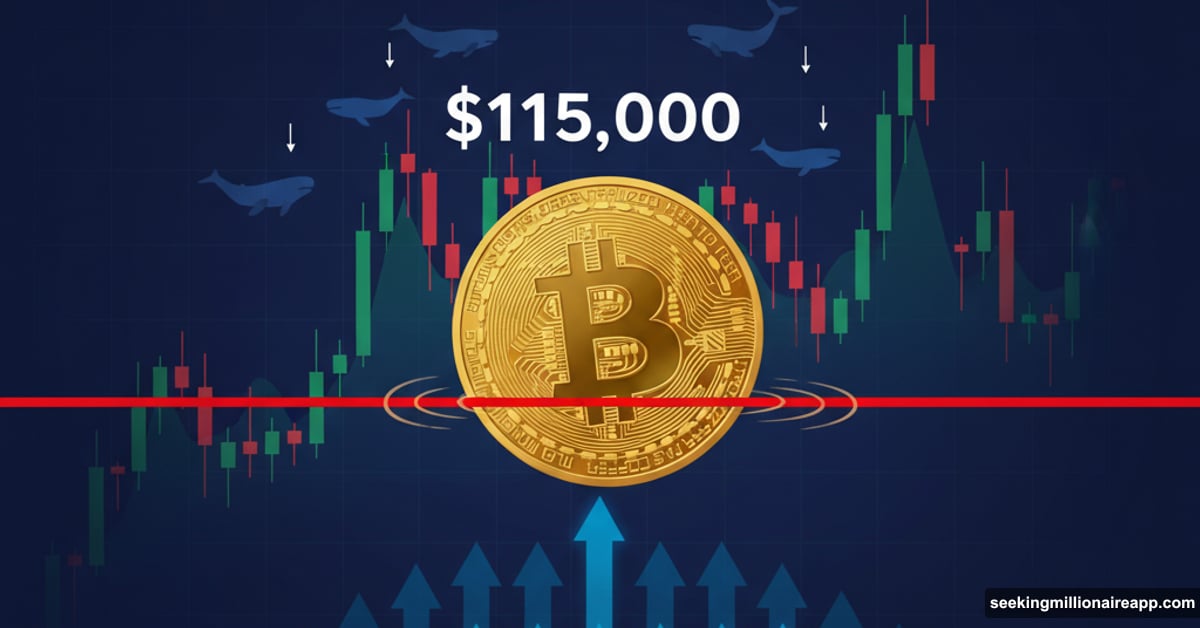
Then something did. This week, BTC briefly crossed $113,200 before getting slapped down near $115,000. The rejection looked sharp and unexpected to most watching the charts.
But the data told a different story. Large holders saw it coming. They prepared for it. And their actions explain exactly why the breakout stalled.
Whales Dumped Right Before the Top
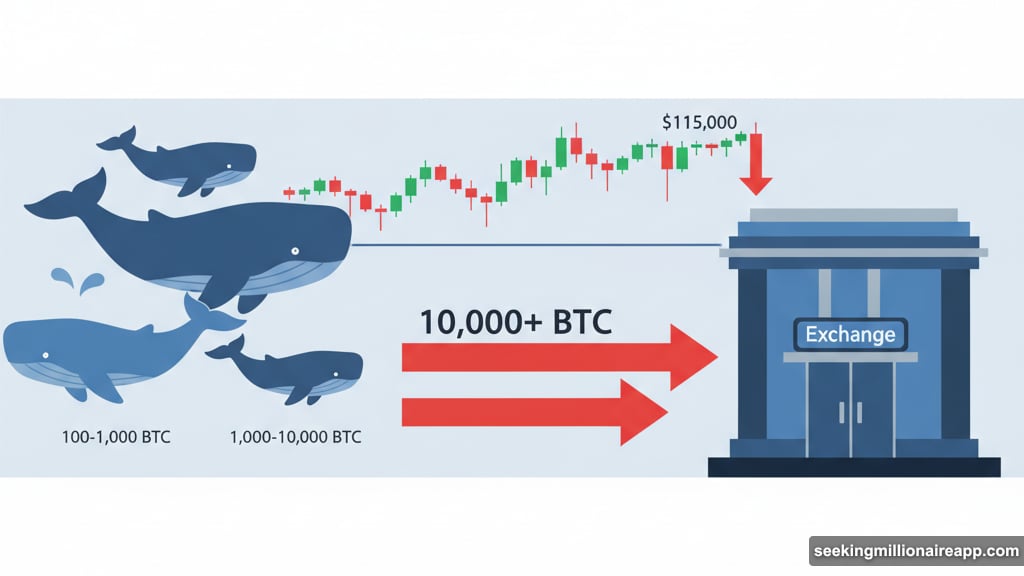
The warning signs showed up on-chain before they appeared on price charts. Between October 25 and 28, Bitcoin’s biggest holders started moving serious amounts to exchanges.
The 100–1,000 BTC holders increased their exchange transfers from 1,046 BTC to 7,191 BTC in just three days. Meanwhile, the 1,000–10,000 BTC group added roughly 3,250 BTC during the same period.
That’s over 10,000 BTC hitting exchanges right as Bitcoin tested $115,000. So when the breakout attempt came, sellers were already positioned and waiting. The supply surge killed momentum before it could build.
This wasn’t random. Large holders clearly anticipated the resistance level and prepared to take profits. Their timing proved accurate.
But Long-Term Holders Keep Buying
Here’s what keeps the bullish case alive. Despite the whale selling, accumulation continues underneath.
Glassnode’s Holder Accumulation Ratio sits at 60.2%. Any reading above 50% means more wallets are adding BTC than reducing it. Plus, that number remains well above the threshold despite recent volatility.
Yes, it’s slightly below the three-month high near 63%. However, the broader trend hasn’t broken. Long-term holders are still quietly absorbing coins that move to exchanges.
This behavior matters because it prevents deeper crashes. When patient buyers catch what whales sell, it stabilizes the structure. That’s exactly what’s happening now.
The Technical Setup Still Works
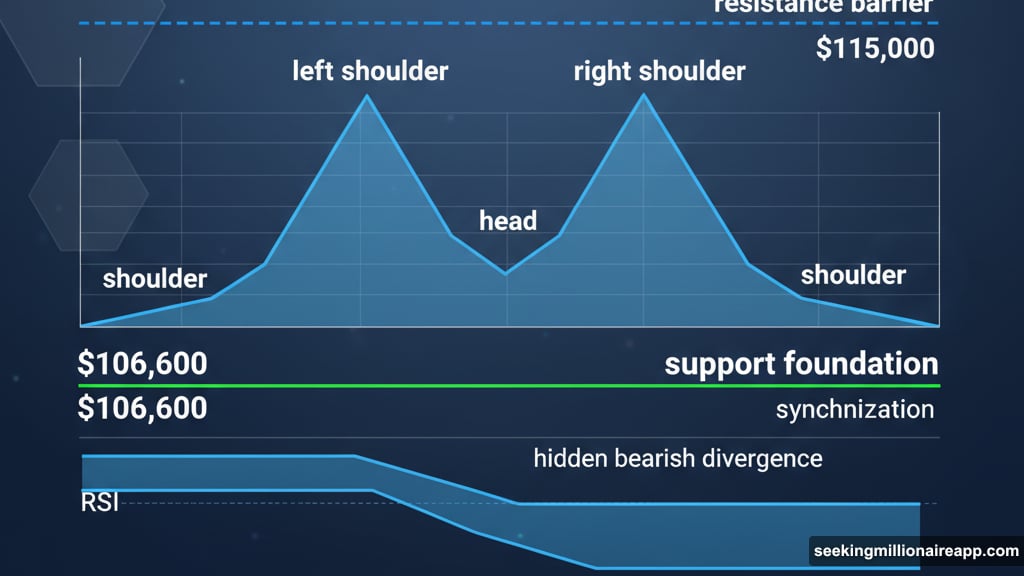
Bitcoin’s chart still shows a clear inverse head and shoulders pattern. This formation typically signals a shift from selling pressure to buying momentum.
The pattern remains valid as long as BTC holds above $106,600. That level acts as the foundation of the entire structure. Break below it, and the bullish thesis falls apart.
But there’s more context here. Between October 13 and 26, the Relative Strength Index formed a hidden bearish divergence. The Bitcoin price made a lower high while RSI made a higher high. That mismatch signaled weakening momentum despite rising prices.
That divergence is why technical traders expected the breakout near $115,000 might fail. And it did exactly that, leading to the current pullback.
Now the divergence has flattened. RSI and price are moving together again. This synchronization shows sellers are losing control. The foundation for recovery is rebuilding.
What Happens at $115K Decides Everything
That level isn’t arbitrary. It capped the last breakout attempt and killed the rally. So it now defines the line between continuation and failure.
If Bitcoin closes decisively above $115,000, the next targets become clear. First, $117,300 comes into play. After that, $125,900 sits near Bitcoin’s all-time high. That represents an 11% gain from current levels.
However, a clean break matters here. A brief spike above $115K followed by rejection won’t cut it. Bitcoin needs to hold above that zone and build support.
The alternative scenario isn’t pretty. If BTC drops below $106,600, the inverse head and shoulders pattern breaks. That could send prices toward $103,500 or lower.
The Data Supports Optimism, But Requires Proof
Everything points toward more upside potential. Long-term accumulation continues. The whale selling appears finished for now. Technical structure remains intact.
But Bitcoin needs to prove it. The failed breakout showed that resistance levels matter. Supply shows up when prices approach major zones. So the next attempt at $115,000 will face similar challenges.
Smart money is watching that level closely. They’ll decide whether to support the break or fade the rally again. Their behavior will determine if Bitcoin can finally push through or faces another rejection.
For now, the setup favors bulls. Just not without conditions. Bitcoin needs to show strength where it previously showed weakness. That’s the only way forward.