
Bitcoin might hit bottom in mid-November. Multiple indicators point to the same timeframe for a reversal.
Traders are watching two key signals. First, the classic death cross pattern forms near $100,000. Second, lunar cycle analysis suggests accumulation opportunities ahead. Plus, the 50-week SMA around $102,800 remains unbroken since early 2023.
These patterns don’t guarantee anything. But they offer a roadmap for what comes next.
Death Cross Doesn’t Mean Market Death
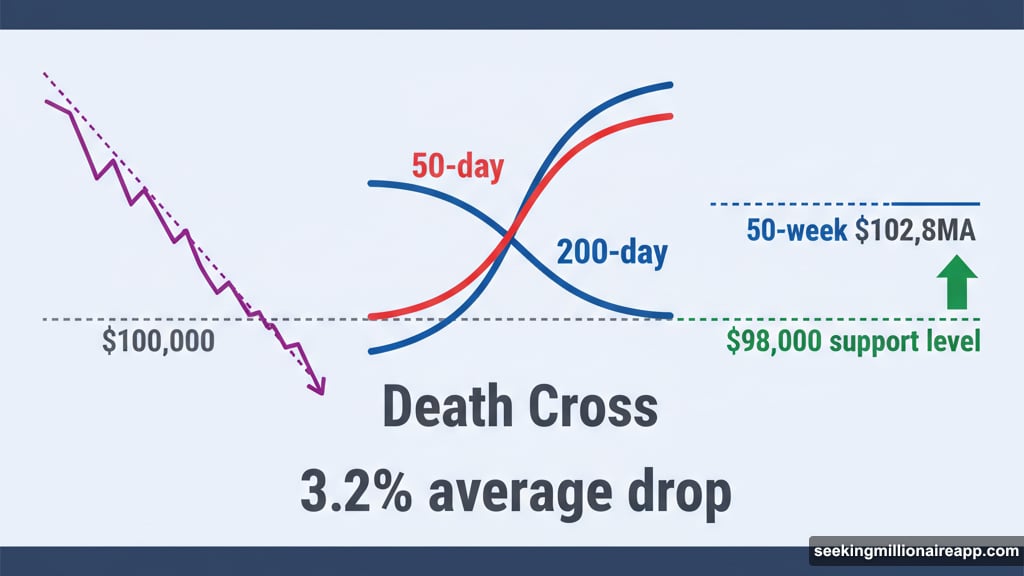
Bitcoin’s 50-day moving average will soon cross below its 200-day average near $100,000. That’s the infamous death cross pattern that scares new traders.
Here’s the twist. Historical data shows this signal often marks local bottoms instead of crashes. Binance’s research reveals the average price drop one month after a death cross is just 3.2%. So the fear is overblown.
Analyst Colin tracks this pattern closely. He expects Bitcoin’s lowest point this cycle around $98,000. That level aligns with multiple support zones including the crucial 50-week simple moving average.
That 50-week SMA sits around $102,800 right now. Bitcoin hasn’t closed a weekly candle below it since Q1 2023. Analyst Ted Pillows calls this the line in the sand for the bull market.
A weekly close beneath $102,800 would break the uptrend structure. But so far, buyers keep defending that level.
Rising Wedge Pattern Suggests Caution
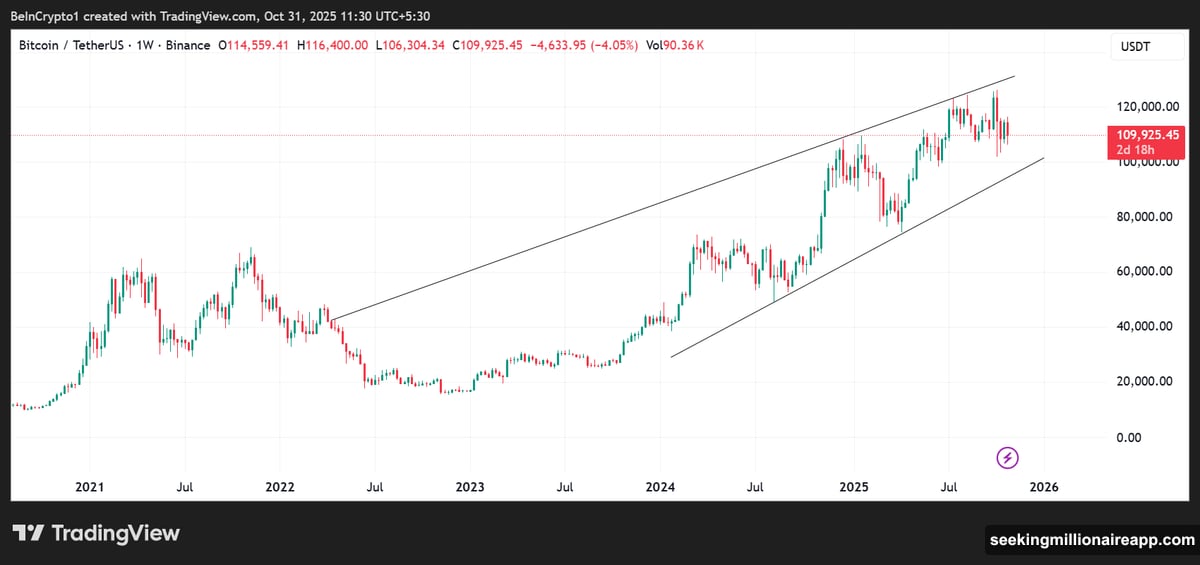
Bitcoin’s weekly chart now shows a rising wedge formation. That’s a bearish pattern where price climbs within converging trendlines.
This setup typically indicates weakening momentum. Previous cycles saw 15% to 35% drops after similar wedges formed. Both 2018 and 2021 followed this script.
Yet the broader bull market structure remains intact. Bitcoin continues printing higher lows and higher highs since 2022. That ascending channel pattern has produced 60% to 170% bounces from the lower range historically.
Some analysts target $170,000 or higher based on this uptrend. The market hasn’t shown typical overbought signals seen at major tops. So the current consolidation between $105,000 and $110,000 looks temporary.
Colin notes this cycle is testing patience. Especially for altcoin holders waiting for their turn. The market stretched beyond the usual Q4 peak timeline that previous cycles followed.
Lunar Cycles Match Technical Analysis
Here’s where things get interesting. Some traders overlay moon phases on Bitcoin’s price chart.
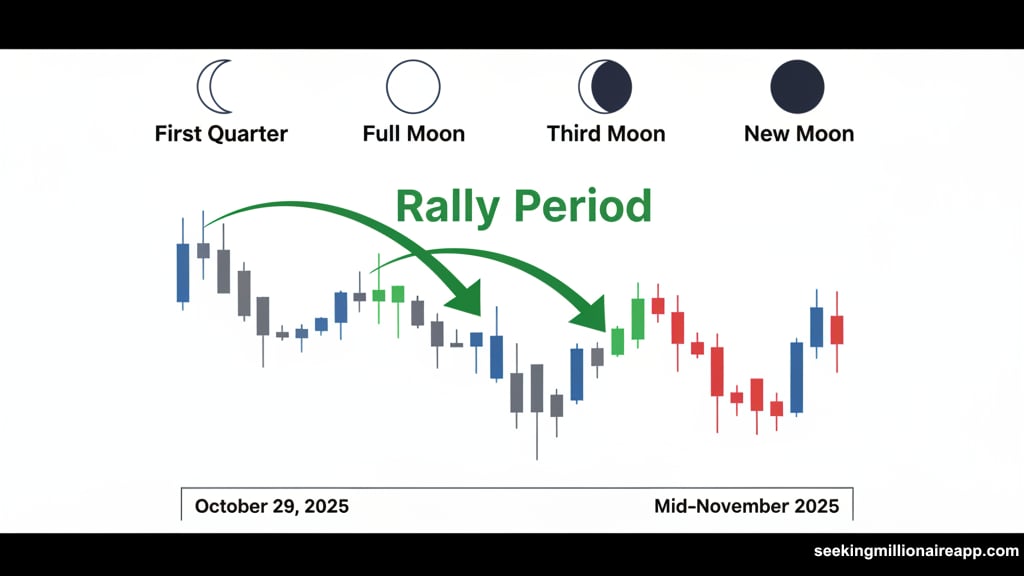
Analyst LP_NXT found a pattern throughout 2025. First Quarter moons often mark the start of rallies. Those rallies typically extend into Full or Third Quarter moon periods.
The First Quarter moon hit on October 29, 2025. According to this theory, that timing could trigger a bullish trend extending into mid-November. That matches the technical view suggesting a November bottom.
Supporters argue these cycles reflect recurring market psychology. Critics dismiss it as superstition. But enough traders track these patterns that they might create self-fulfilling prophecies.
The alignment is striking though. Technical indicators, support levels, and lunar timing all point to the same November window.
Key Support Levels Define the Battle
The 50-week SMA around $101,700 remains the critical threshold. Bitcoin held this level throughout the current bull run starting Q1 2023.
Colin identifies $98,000 as the reasonable floor. That zone combines multiple support alignments including the 50-week SMA and previous consolidation areas.
Binance data confirms this level’s importance. Breaking below it would signal a potential shift in market structure. But holding above it maintains the bull market framework.
The death cross near $100,000 adds psychological weight. New traders might panic and sell. Experienced traders might view it as a buying opportunity instead.
What Smart Traders Are Doing Now
Colin’s strategy focuses on patience. He suggests holding Bitcoin until new all-time highs appear. Then rotate into altcoins using Bitcoin-denominated gains a few weeks later.
The market is shaking out weak hands right now. Those expecting a traditional Q4 peak face disappointment. But that creates opportunities for patient capital.
Ledger’s educational materials note death crosses often signal capitulation. That’s when exhausted sellers finally give up. It marks reversals more than predicting future drops.
November 2025 shapes up as the decisive month. Bitcoin’s ability to hold the 50-week SMA determines what happens next. Both conventional technical analysis and unconventional lunar timing suggest mid-November as the inflection point.
Whether you believe in moon phases or not doesn’t matter. What matters is enough traders watch these signals that they influence price action. The market creates its own reality through collective belief and behavior.
The setup is clear. Multiple timeframes and methods converge on the same conclusion. November likely brings either a confirmed bottom or a breakdown of the bull structure.