
Ethereum kicked off November with a quiet 1% gain, reaching $3,875. Whales just scooped up nearly $775 million worth of ETH in 48 hours. That’s a bullish signal, right?
Not so fast. A death cross is forming on the charts. This technical pattern has historically triggered sharp corrections. So while big money piles in, the price structure tells a different story.
The next few days could determine whether whale confidence pays off or gets crushed by technical breakdown.
Whales Added 200,000 ETH in Two Days
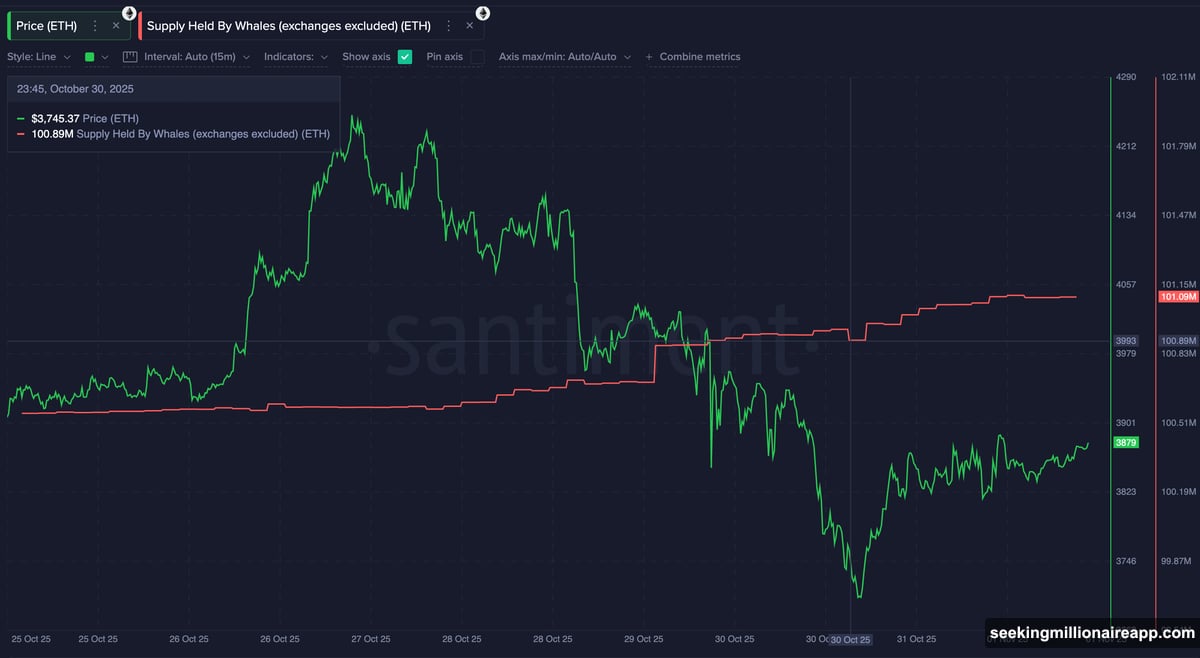
The numbers are clear. Between October 30 and November 1, Ethereum whale wallets grew from 100.89 million ETH to 101.09 million ETH. That’s roughly 200,000 ETH accumulated in just 48 hours.
At current prices, that represents about $775 million in fresh buying power. Big holders are positioning for something. They clearly expect November to deliver better returns than October’s sluggish performance.
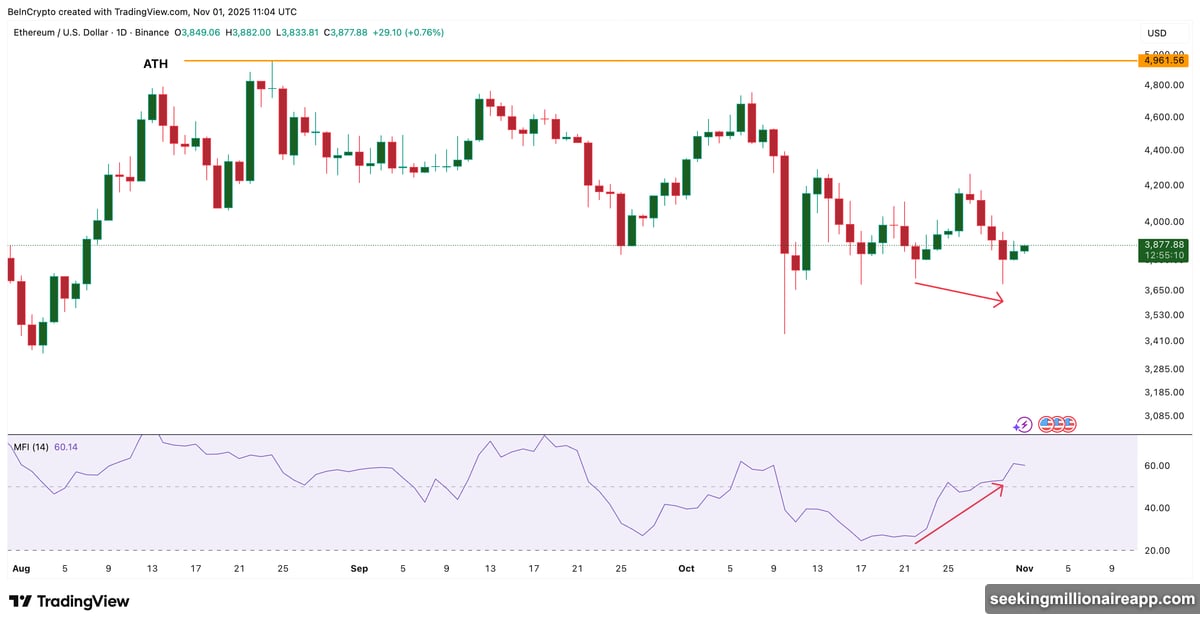
But whales aren’t acting alone. Retail investors are joining the party too. The Money Flow Index has been climbing since October 28, showing steady inflows even as prices dipped slightly.
This creates what technical analysts call a bullish divergence. Between October 22 and October 28, ETH made lower lows. Yet the MFI made higher lows. That means buyers were quietly absorbing supply at lower prices, building a foundation for potential upside.
However, long-term holders started taking profits recently. Those outflows partially offset the whale and retail buying, creating a more complex picture than pure accumulation would suggest.
The Death Cross That Could Change Everything
Here’s where things get tense. Ethereum’s 20-day exponential moving average is about to cross below its 100-day EMA. That setup is called a death cross.
Why does this matter? When short-term momentum drops below longer-term trends, it often signals that sellers are gaining control. The last time Ethereum formed a death cross, prices fell 13.7%.
That previous cross happened between the 20-day and 50-day EMAs in mid-October. It triggered a painful correction that wiped out weeks of gains. Now a potentially larger cross is forming between the 20-day and 100-day lines.
The timing couldn’t be worse for bulls. Just as whales start accumulating and retail investors show interest, the chart structure threatens to undermine that optimism.
Plus, long-term ETH holders continue selling. That adds downward pressure right when technical signals already look shaky. The combination could overwhelm recent buying momentum if the cross confirms.
But there’s a catch. If whale and retail buying intensifies enough to push ETH above the 100-day EMA, the death cross might fail to form. That would keep the bullish structure intact and give buyers a real chance to extend the rally.
Breakout at $4,069 or Breakdown at $3,680
The chart shows an unusually balanced setup. Support and resistance sit almost equal distances from current prices. A 4.9% move in either direction could define Ethereum’s short-term path.
If the death cross confirms, ETH could drop 4.9% to $3,680. That’s the first major support level. Below that, $3,446 comes into play if selling accelerates.
However, if continued accumulation from whales and retail traders pushes prices higher instead, a 4.9% gain would lift ETH to $4,069. A daily close above that level would confirm a short-term breakout.

That breakout would open the path toward $4,265, and potentially $4,487 if momentum builds. Those levels would turn November into a genuinely strong month for Ethereum, delivering gains most traders didn’t expect after October’s weakness.
So the next few days are critical. The symmetry between upside and downside potential means neither outcome is obvious yet.
Why This Setup Feels Different
What makes this situation unusual is the mixed signals. Whale buying typically precedes rallies. Retail buying usually follows once momentum builds. Both are happening now.
Yet the technical structure looks increasingly fragile. Death crosses don’t always trigger corrections, but they’re right more often than wrong. The previous one in mid-October delivered exactly the breakdown it predicted.
Moreover, profit-taking by long-term holders adds a layer of complexity. These aren’t weak hands selling in panic. They’re experienced holders who’ve watched ETH through multiple cycles. Their selling suggests caution even as newer buyers accumulate.
The Money Flow Index bullish divergence provides some hope. That pattern often precedes reversals when prices are falling but money keeps flowing in. It shows accumulation happening beneath the surface, which can fuel sudden upward moves.

Still, technical patterns usually win when they conflict with on-chain signals. The death cross represents momentum, while whale buying represents positioning. Momentum tends to dominate in the short term.
What Happens Next
Ethereum now sits at a genuine inflection point. The distance to major support at $3,680 equals the distance to resistance at $4,069. That 4.9% move in either direction will likely determine the trend for weeks.
If whale accumulation continues and retail interest grows, ETH could break above $4,069. That would invalidate the death cross setup and shift momentum back to bulls. November could then deliver the gains that October failed to provide.
But if the death cross confirms and selling accelerates, $3,680 becomes the target. Breaking below that level would open the door to $3,446 and potentially deeper losses.
The next 72 hours matter. Watch for the 20-day EMA either crossing below the 100-day EMA or bouncing back above it. That single technical event could determine whether whale confidence pays off or gets crushed by market mechanics.
Right now, it’s genuinely unclear which outcome will win. The balance between bullish on-chain activity and bearish technical structure is almost perfect. That makes this setup fascinating to watch but dangerous to trade without clear confirmation.