Bitcoin’s technical setup screams “breakout coming.” But the price keeps bouncing off the same ceiling like a bird smacking into clean glass.
The charts show a textbook reversal pattern. On-chain data reveals whale wallets quietly adding more coins. Yet BTC can’t punch through $112,500. Something’s holding it back, and the answer lies in where investors bought their coins months ago.
A Wall of Sellers Blocks the Path
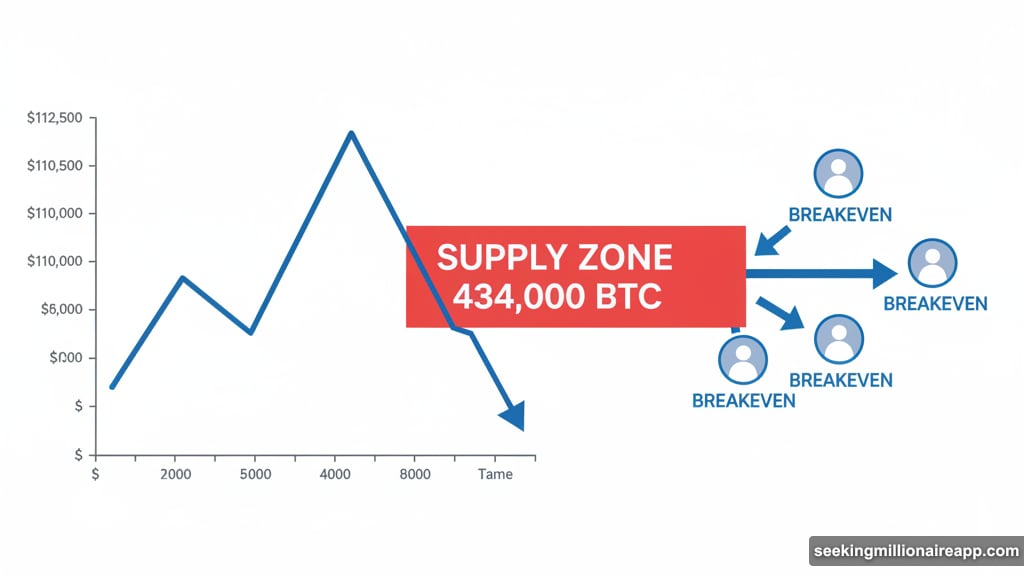
Between $110,000 and $112,500 sits a massive supply zone. About 434,000 BTC were last purchased at these levels, according to cost basis distribution data from Glassnode.
Think of it like traffic at a toll booth. When price approaches these levels, thousands of traders who bought here months ago suddenly see their breakeven point. Many decide to sell and walk away even. So selling pressure surges right where Bitcoin needs momentum most.
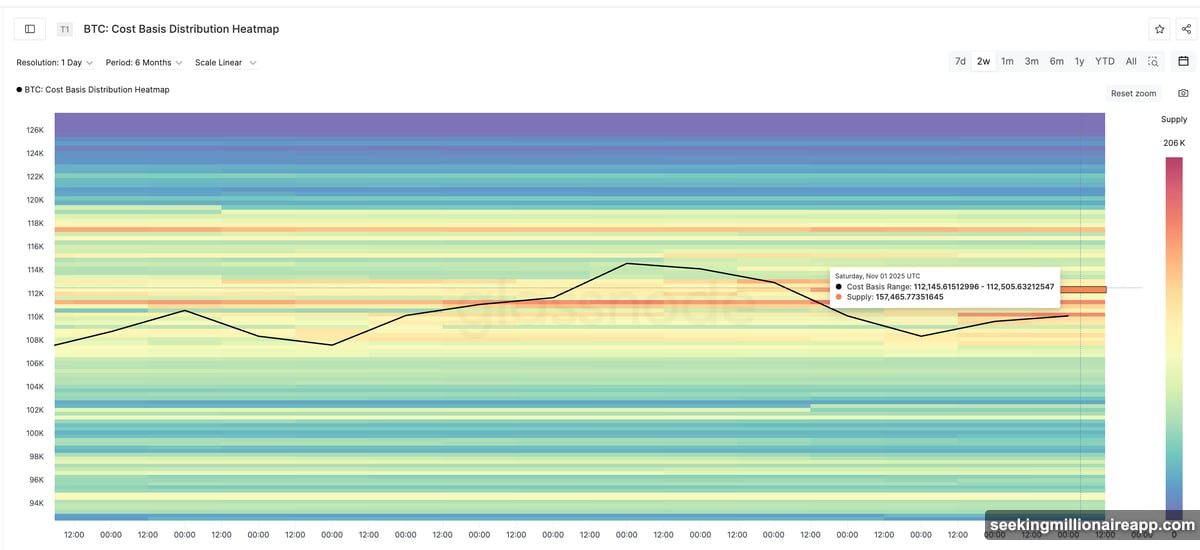
This zone has capped every rally attempt for the past week. The technical chart confirms what the data shows. That $112,590 resistance level isn’t random. It marks the exact spot where holder behavior creates natural selling pressure.
Plus, this supply wall explains why bullish patterns keep stalling. The structure for a breakout exists. But until Bitcoin absorbs or pushes through this seller concentration, the move stays stuck.
Whales Are Quietly Accumulating Again
Large Bitcoin holders might be preparing to change that dynamic. Wallets holding 1,000 to 10,000 BTC are accumulating again after months of sitting idle.
The 30-day whale address count just turned positive for the first time since August 31. Specifically, it increased by six addresses. That might sound small. But whale movements often signal major shifts before they become obvious.
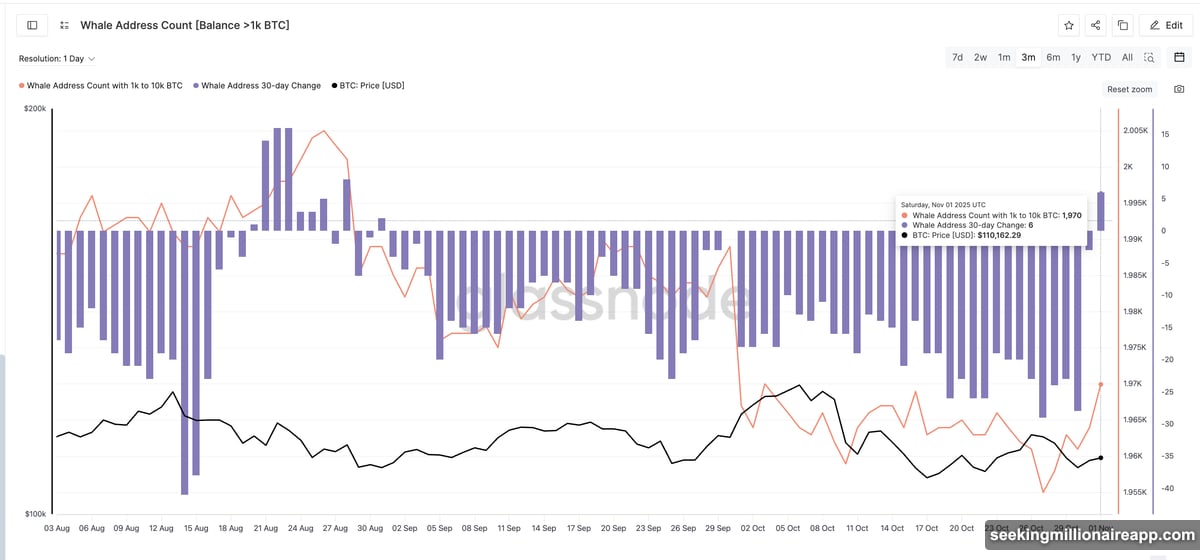
Total whale addresses dropped to a three-month low on October 27. Since then, they’ve been climbing steadily. Now they sit around the same level last seen on October 3.
This uptick shows renewed confidence from big players. When whales accumulate, they usually see value others haven’t recognized yet. Moreover, their buying power can absorb the selling pressure from smaller holders in that $110,000-$112,500 zone.
If this trend continues, whales could provide the force needed to push through resistance. Their wallets include exchange, ETF, and custodian addresses, giving a broad view of institutional activity. And institutions rarely accumulate without a plan.
The Technical Setup Remains Bullish
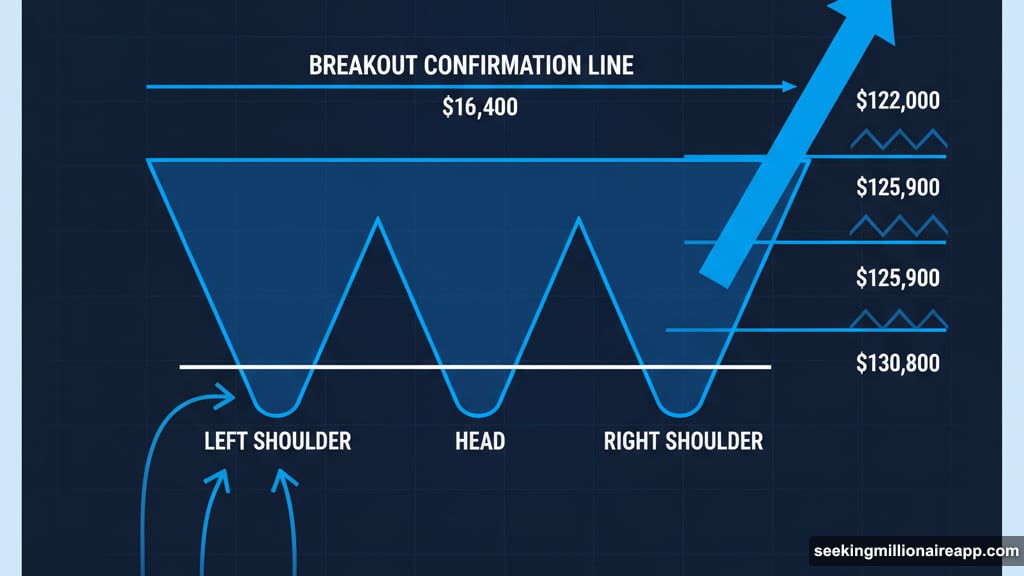
Despite the stalled breakout, Bitcoin’s chart still shows a clear inverse head and shoulders pattern. This formation typically signals a major trend reversal from down to up.
A daily close above $116,400 would confirm the breakout. That would open targets at $122,000, then $125,900, and potentially $130,800. Those aren’t random numbers. They’re measured moves based on the pattern’s structure.
The Relative Strength Index adds another bullish signal. Between October 22 and October 30, Bitcoin’s price made lower lows while RSI made higher lows. This divergence often appears right before momentum shifts upward.
However, the bullish case has clear invalidation levels. If Bitcoin drops below $106,200, the reversal pattern starts losing shape. A fall under $103,500 would completely invalidate the setup and hand control back to sellers.
That $112,500-$112,590 zone remains the critical battleground. It’s where cost basis data, technical resistance, and whale accumulation all converge. So the next major move likely hinges on what happens at this exact level.
The Stalemate Won’t Last Forever
Bitcoin is coiled between a technical breakout pattern and a supply wall created by previous buyer behavior. Neither side has won yet.
Whales are positioning themselves for a move. The chart structure remains intact. But price action shows clear hesitation at proven resistance levels. Something has to give.
Watch that $112,500 zone closely. A decisive break above signals the breakout is finally happening. A rejection there followed by weakness below $106,200 means sellers took control. Until one of those scenarios plays out, Bitcoin stays stuck in this frustrating middle ground.
The setup is there. The catalyst is forming. Now it’s just a waiting game to see which force wins.