
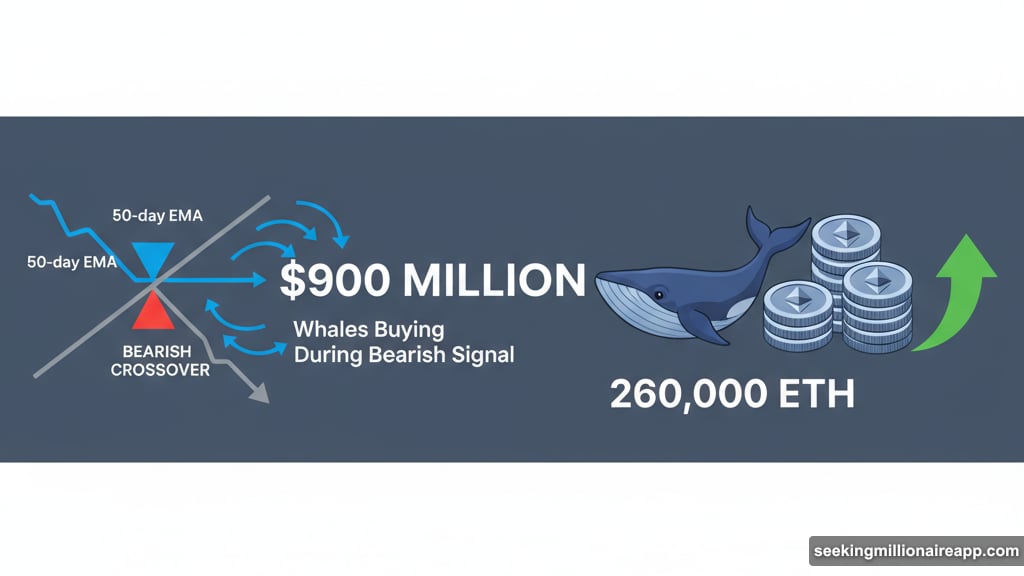
Ethereum price dropped 17.5% this month. But whales aren’t panicking. Instead, they just bought nearly $900 million worth of ETH.
Why? Technical charts scream caution with bearish signals forming. Yet large holders see something different. They’re positioning for what could be a major move up.
Two Bearish Crossovers Form
Ethereum’s daily chart shows trouble brewing. The 50-day EMA is about to cross below the 100-day EMA. That’s a classic warning sign that momentum is shifting down.
Plus, there’s more. The 20-day EMA is inching toward the 200-day EMA. If selling pressure continues, this second crossover could follow fast.
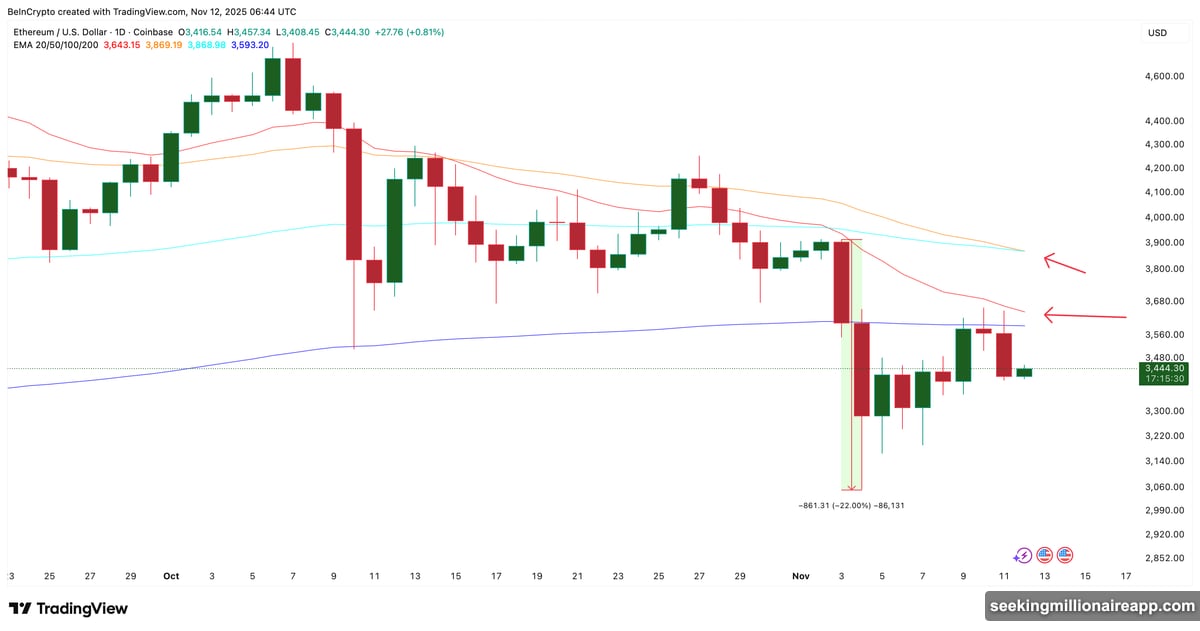
Remember what happened in early November? The 20-day EMA dropped below the 100-day EMA. ETH crashed 22% within a week.
So technical traders have good reason to worry. These patterns usually signal more pain ahead. Yet whales keep buying anyway.
$900 Million Whale Accumulation Tells Different Story
On-chain data from Santiment reveals what’s really happening. Between November 10 and November 12, large wallets increased their ETH holdings from 101.44 million to 101.70 million tokens.
That’s 260,000 ETH added in just two days. At current prices around $3,445, that equals roughly $900 million. These aren’t small retail traders panic-buying dips. These are sophisticated players with massive capital.
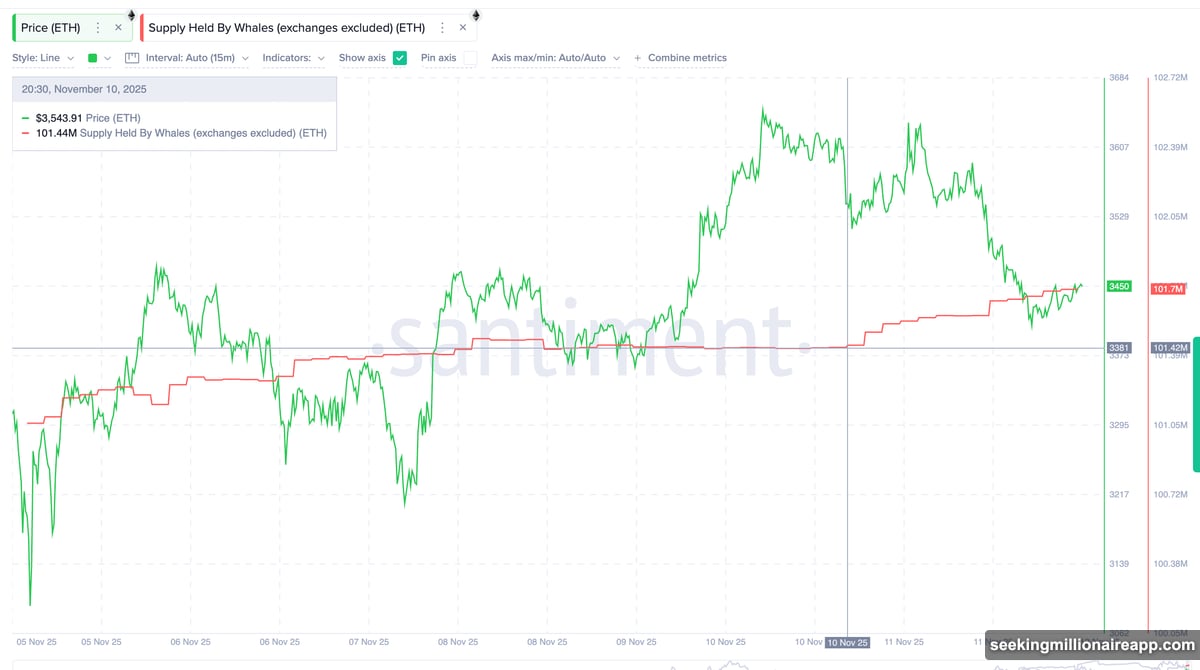
Moreover, this happened while bearish signals formed. So whales clearly see these price drops as opportunity, not danger. They’re betting the short-term weakness won’t last.
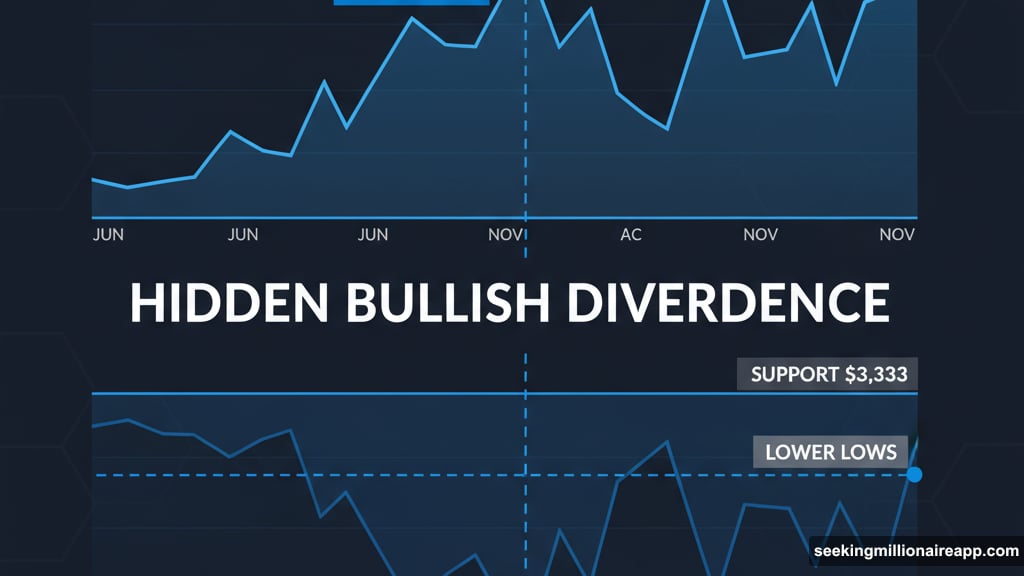
Hidden Bullish Divergence Explains Whale Confidence
Here’s what whales probably noticed. Between June 22 and November 4, Ethereum price formed higher lows. Meanwhile, the RSI momentum indicator made lower lows.
This creates what technical analysts call a hidden bullish divergence. It suggests the uptrend that started in June is actually holding strong beneath surface weakness.
So while charts look concerning to most traders, whales see underlying strength. They’re betting this divergence plays out with a significant move higher.
However, they need confirmation. Ethereum must hold above $3,333 support. If it does, targets of $3,650 and $3,994 come into play.
$3,994 Breakout Level Tests Whale Conviction
That $3,994 level is crucial. A daily close above it would break the bearish EMA crossover pattern completely. Then bulls could target $4,251 and even $4,762.
But the opposite scenario exists too. If ETH breaks below $3,333, the bearish signals win. That would likely trigger a test of $3,050 support and potentially shake out weak hands.
For now, Ethereum trades at $3,445. It’s caught between bearish technical signals and aggressive whale accumulation. One side will be right soon.
Retail Sees Risk, Whales See Reward
The contrast here is striking. Technical charts show multiple warnings. EMAs are crossing bearishly. Short-term momentum looks weak. Most retail traders would naturally stay away or reduce positions.
Yet whales added nearly $900 million in fresh ETH during this exact period. They’re either ignoring the signals or interpreting them completely differently.
My take? Whales are playing a longer game. They know short-term bearish patterns can create perfect entry points. If that hidden bullish divergence plays out, today’s prices will look cheap in weeks.
Still, nobody knows for certain. Markets punish overconfidence regularly. So watch that $3,333 support level closely. It’s where we’ll learn if whales made a brilliant move or a costly mistake.