
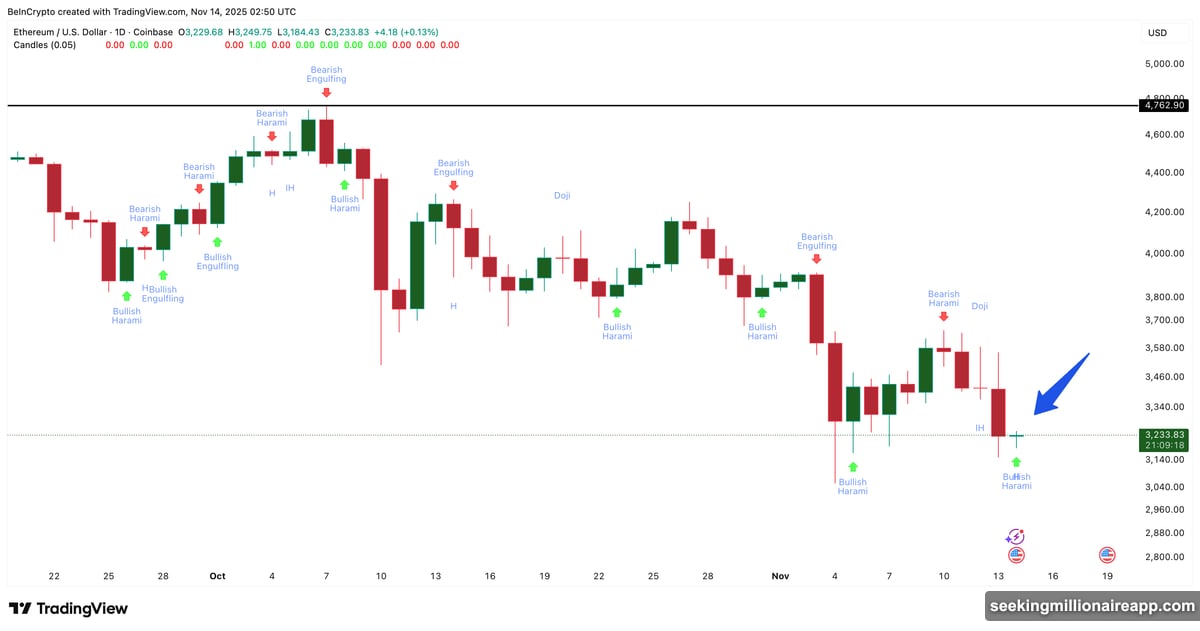
Ethereum just printed a bullish harami pattern on the daily chart. That’s typically good news. But the setup comes with a catch that could kill the rally before it starts.
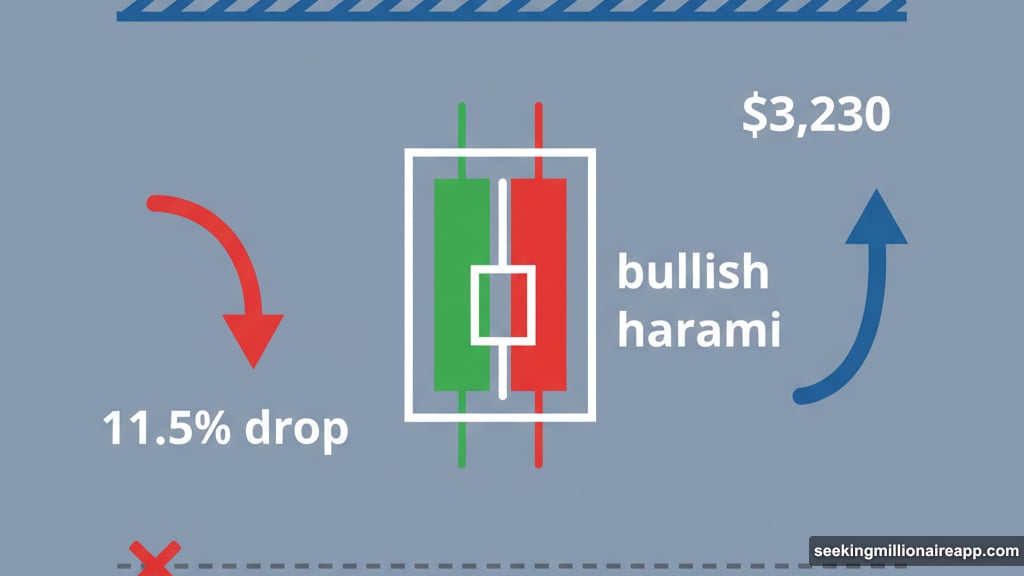
The token fell 11.5% in 24 hours before recovering roughly 2.5%. Now it trades above $3,230. Yet the daily ticker still shows a near 6% loss. That sharp correction carved out a technical reversal pattern, but whale behavior tells a different story.
Whales Keep Dumping Despite Bullish Pattern
A bullish harami appears when a small green candle sits completely inside the previous day’s larger red candle. It signals selling pressure may be slowing. Buyers attempt to regain control.
However, Ethereum tried this exact setup on November 5. That bounce failed because buying strength faded quickly. So the current pattern carries extra weight. Can buyers sustain momentum this time?
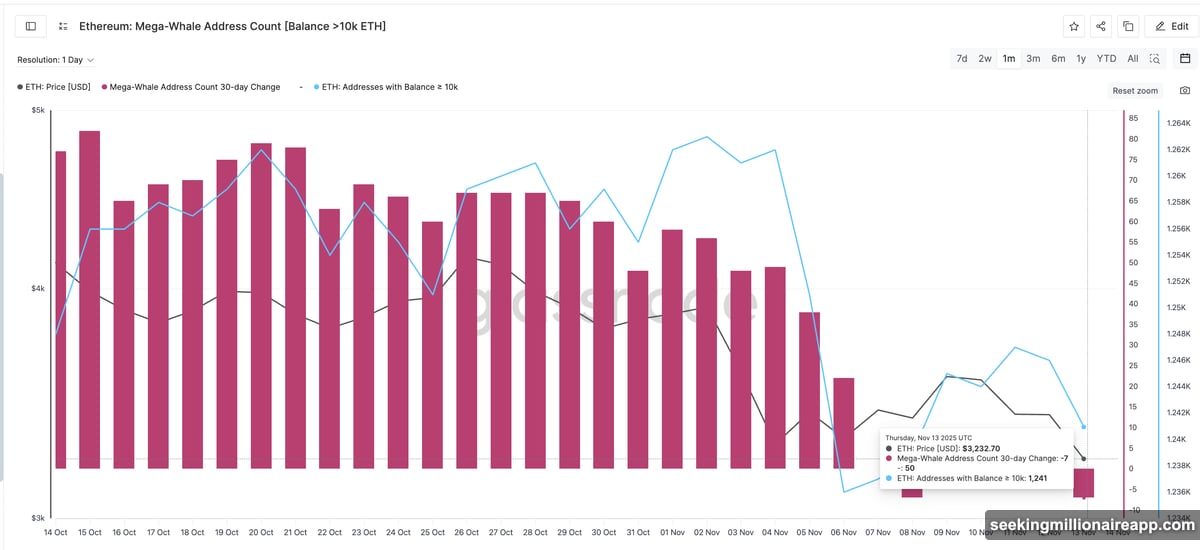
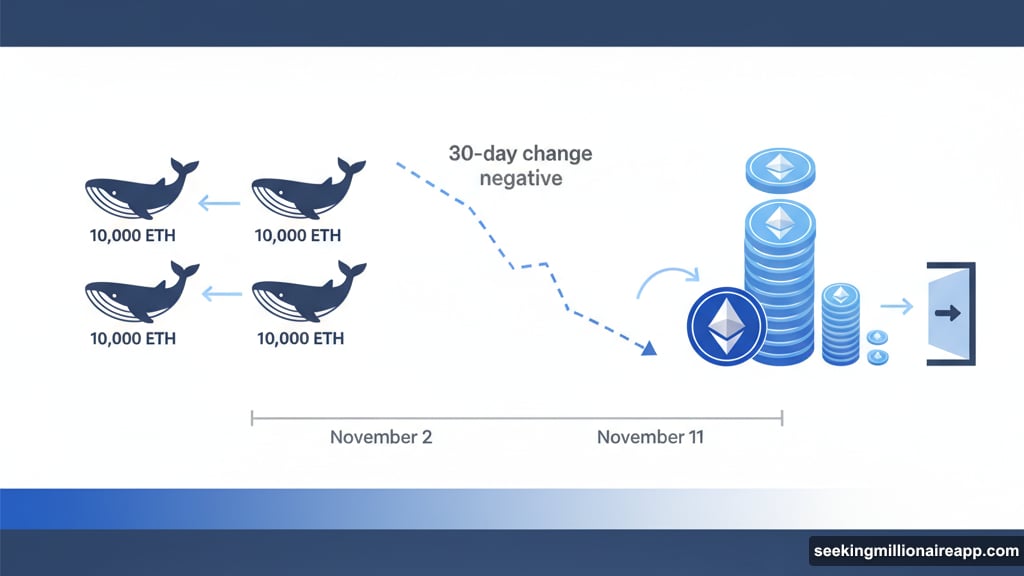
The pressure comes from whale wallets. Data tracking addresses holding over 10,000 ETH shows concerning trends. The 30-day change in mega-whale wallets has dropped again. Plus, it’s back to the same negative level seen on November 8.
Moreover, the total number of 10k+ ETH addresses has fallen consistently since November 2. A brief pickup occurred from November 6 to 11 during a short rebound. But the decline returned immediately after.
That withdrawal of large holder support coincides with Ethereum’s recent bearish crossover. So even though the bullish harami is active, whales aren’t backing the move yet. That weakness undermines the reversal setup.
The $3,650 Level Decides Everything
If the bullish pattern holds, Ethereum faces an immediate test near $3,333. That short-term resistance has limited rebounds this week. But the real battle sits higher at $3,650.
Reaching that level requires a 12% move from the recent low. And the cost-basis distribution heatmap reveals why it matters so much. This tool maps where large amounts of ETH last changed hands.
The $3,638 to $3,667 zone holds one of the biggest supply clusters on the entire chart. In fact, over 1.5 million ETH sits in that narrow band. Clearing this zone would prove strong buyer commitment.
That’s exactly why $3,650 becomes the mega test. A daily close above this supply cluster would confirm the harami is working. Plus, it could open the door for a broader recovery toward previous highs.
But losing support near $3,150 weakens the pattern fast. And a sharp drop below $3,050 would completely invalidate the bullish structure. That would allow sellers to push lower, repeating the failed setup from earlier this month.
Whale Behavior Matters More Than Chart Patterns
Technical setups work best when fundamental flows support them. Right now, Ethereum’s chart suggests a reversal. Yet whale wallets continue shrinking their positions.
The mega-whale address count tracks 30-day changes in 10k+ ETH wallets. That metric has been negative since early November. Meanwhile, total addresses in this category keep declining despite brief pauses.
This divergence between chart patterns and on-chain data creates uncertainty. Bullish haramis typically signal buyer strength returning. But whales stepping back suggests caution among the largest holders.
So the setup becomes binary. Either buyers push through $3,650 and force whales to chase. Or the pattern fails again like it did on November 5, and Ethereum tests lower support.
What Happens Next
The next 48 hours matter enormously. Ethereum needs to hold $3,150 as support while building momentum toward $3,333. That first resistance test will show whether buyers have genuine strength.
Then comes the real challenge at $3,650. Breaking through 1.5 million ETH in supply requires serious buying pressure. And it needs to happen while whales remain net sellers.
If Ethereum closes above $3,650, the reversal gains credibility. That move would trap sellers who positioned near resistance. Plus, it could trigger whale accumulation again if the breakout holds.
But if price stalls before reaching that level, or worse, loses $3,150 support, the bearish case strengthens. A drop below $3,050 would invalidate the entire setup and likely trigger another leg down.
The pattern is clear. The whale behavior is cautious. And the mega test sits just 12% above the recent low. Ethereum’s next major move depends entirely on whether buyers can prove they’re serious this time.