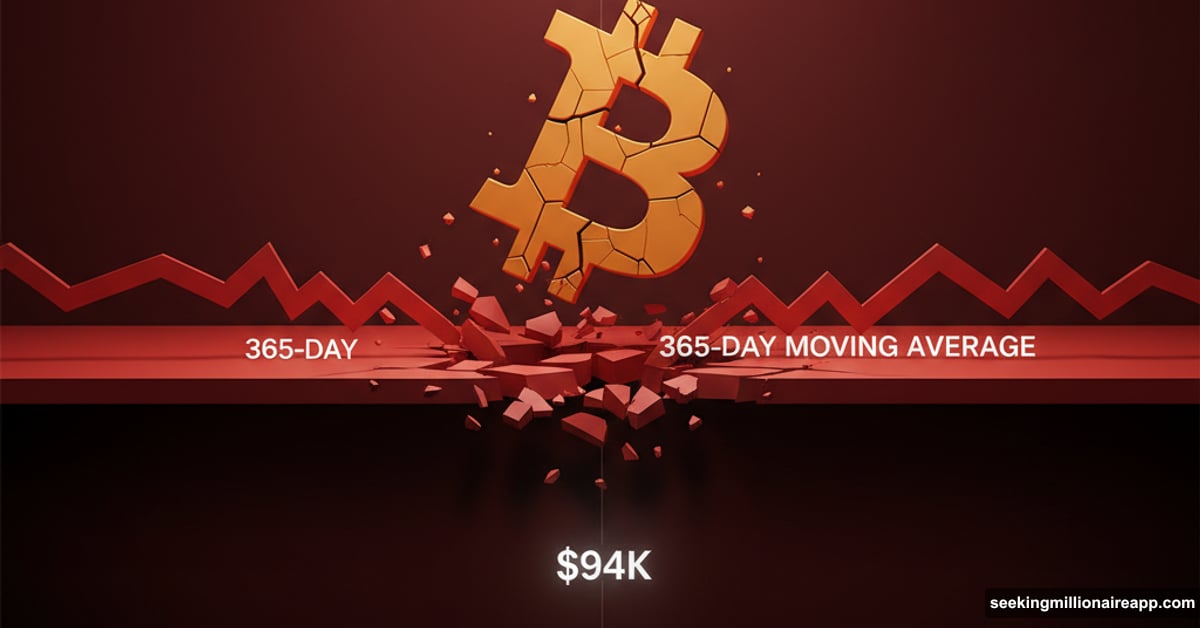
Bitcoin broke a critical support level this week. The 365-day moving average that held the entire bull market just failed.
Now price sits at $94,000. That’s below the average cost for millions of recent buyers. Plus, history shows what happens next rarely ends well.
Let’s examine what broke, where Bitcoin might land, and whether this signals a full bear market or just another mid-cycle reset.
The 365-Day Moving Average Just Failed
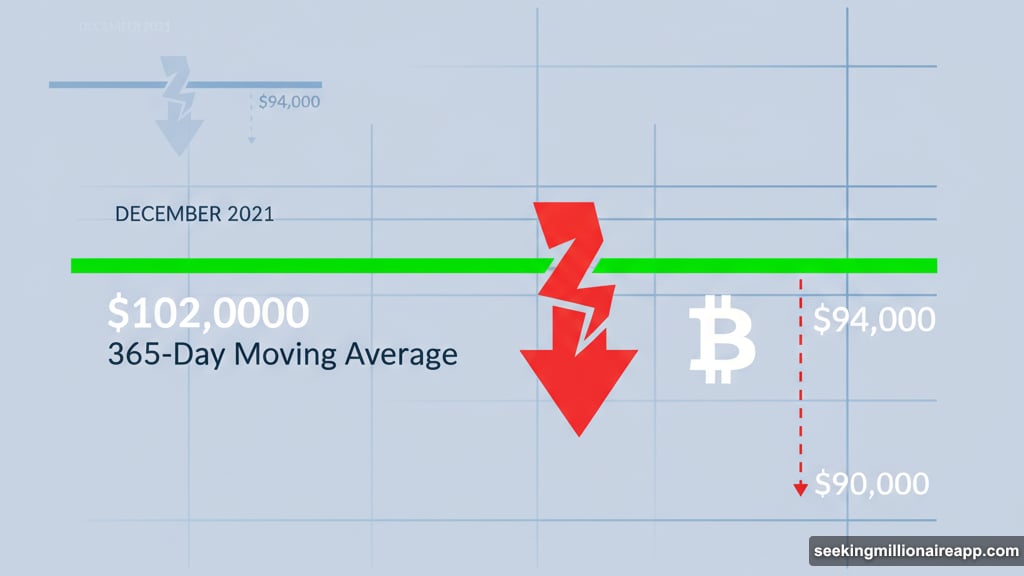
Bitcoin fell below its 365-day moving average near $102,000. That line acted as the primary structural floor since late 2023.
This breakdown matters because the same pattern appeared in December 2021. Back then, repeated failures at this level marked the start of the 2022 bear market. Price never recovered until the cycle turned.
However, the current setup differs in key ways. Liquidity remains unstable. ETF flows turned negative. Long-term holders distributed coins at the fastest pace since early 2024. But the broader market context suggests a mid-cycle correction rather than a macro top.
Still, losing the 365-day average creates serious technical damage. Historically, staying below this line for several weekly closes triggers deeper retracements. So the probability of a move toward sub-$90,000 just increased.
Recent Buyers Are Now Underwater
On-chain data shows the realized price for holders who bought 6 to 12 months ago sits near $94,600. This group accumulated heavily during the ETF-driven rally. Their cost basis often acts as a first capitulation zone in bull markets.
Bitcoin briefly traded below this threshold on Friday. That pushed many recent buyers into unrealized losses. Similar breaks occurred in 2017-2018 and 2021-2022. Each period saw prolonged declines after price slipped below the 6-12 month cost-basis band.
This trend suggests rising pressure on recent buyers. Moreover, it increases the chance of a deeper reset as these holders face mounting losses. The question now becomes whether they capitulate or hold through the drawdown.
Mid-Cycle Corrections Hit 25% to 40% Historically
Long-range cycle data provides useful context. Bitcoin’s bull cycles show recurring mid-cycle corrections between 25% and 40%.
Using the 2025 peak near $125,000, a typical pullback would place Bitcoin between $75,000 and $93,000. These drawdown levels align closely with current technical and on-chain support floors.
Furthermore, almost 7 million BTC transacted on-chain in 2025. Most came from 2024 transactions. One big whale from 2011 sold 84,000 BTC. Some sellers from 2017-2023 added pressure. But overall, this represents normal distribution patterns rather than panic selling.
That suggests the market hasn’t reached exhaustion yet. So the current weakness likely forms part of a consolidation within the bull market, not the start of a multi-year downtrend.
Three Key Support Zones Could Stop the Bleeding
Analysts identify three major price levels that could halt the decline.
First support sits at $92,000 to $95,000. This matches the 6-12 month cost basis and recent ETF inflow levels. Bitcoin currently trades in this zone. So this area will likely produce the first meaningful reaction.
Stronger correction targets the $85,000 to $90,000 band. This aligns with a standard 25-30% mid-cycle decline. Many technical analysts expect Bitcoin to at least test this range before finding a lasting bottom.
Bearish scenario extends to $75,000 to $82,000. This would represent a 35-40% drawdown from the cycle high. It matches previous mid-cycle resets during the 2017 and 2021 bull runs. However, reaching this level requires accelerating ETF outflows and worsening macro conditions.
Drops below $70,000 remain unlikely without a major liquidity shock. Bitcoin hasn’t shown a blow-off top or structural exhaustion pattern yet.

ETF Flows and Macro Conditions Drive the Downside
The Bitcoin ETF market turned negative for the first time since launch. Institutional flows that supported price throughout 2024 reversed. That removed a major pillar of demand.
Meanwhile, liquidity conditions remain unstable. The broader macro environment shows stress. Interest rates stay elevated. Risk assets face pressure across the board. So Bitcoin trades in a challenging backdrop that limits upside momentum.
Long-term holders contributed to selling pressure. Distribution reached levels not seen since early 2024. These holders typically sell into strength during bull markets. Their accelerating distribution suggests they view current levels as favorable exit points.
Combined, these factors create downward pressure. But they don’t confirm a bear market. Instead, they point to a healthy correction within an ongoing bull cycle.
Recovery Above $102K Changes Everything
Bitcoin’s ability to reclaim the 365-day moving average near $102,000 will determine the correction’s depth. A quick recovery would ease selling pressure. It would also reduce the likelihood of a move under $90,000.
Continued rejection at this level raises different odds. Then the probability of testing mid-cycle support zones between $75,000 and $90,000 increases significantly. Plus, sustained weakness below the 365-day average could trigger additional liquidations from leveraged positions.
For now, the market sits at a critical junction. Short-term price action over the next few weeks will clarify whether this represents a temporary shake-out or the beginning of a deeper correction.
Watch ETF flows closely. Monitor on-chain cost-basis levels. Track how Bitcoin reacts to tests of key support zones. These indicators will provide early signals of whether buyers step in or sellers maintain control.
The bull market isn’t dead yet. But it just took its first serious punch. How Bitcoin responds to this breakdown determines whether it bounces back stronger or slides deeper into correction territory.