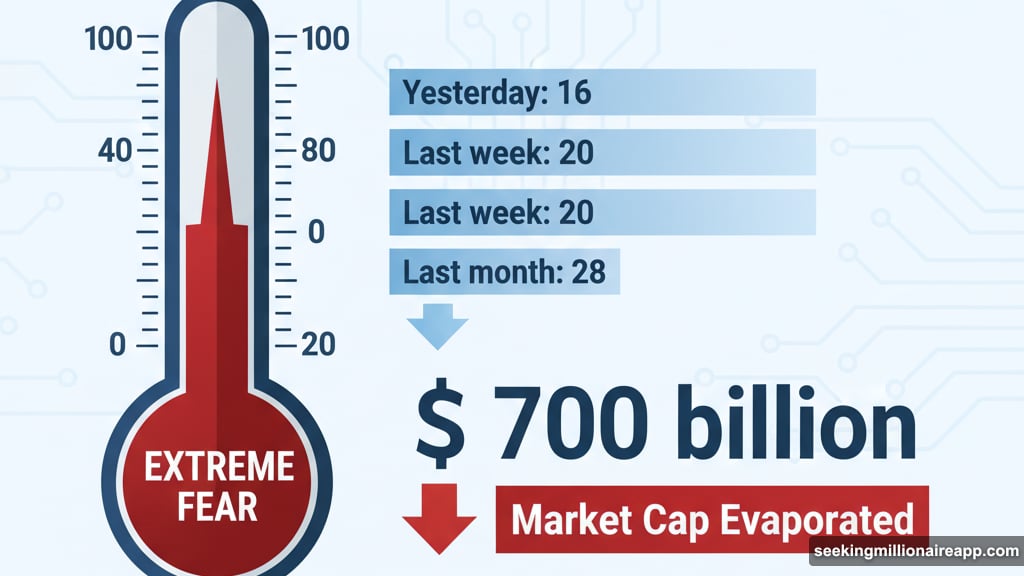
Bitcoin just dropped below $100,000 again. The Fear and Greed Index hit 10. Plus, over $700 billion evaporated from the crypto market in a month.
So naturally, everyone’s asking the same question. Are we in a bear market now?
Not yet. But we’re closer than most people realize.
The Fear Signal That Actually Matters
Extreme fear doesn’t automatically mean bear market. But it does reveal where sentiment sits right now.
The Fear and Greed Index crashed to 10 yesterday. That’s the same level we saw in early 2022 and June 2022. Both times marked confirmed bear phases where Bitcoin kept falling for months.
Here’s what changed recently:
- Yesterday: 16
- Last week: 20
- Last month: 28
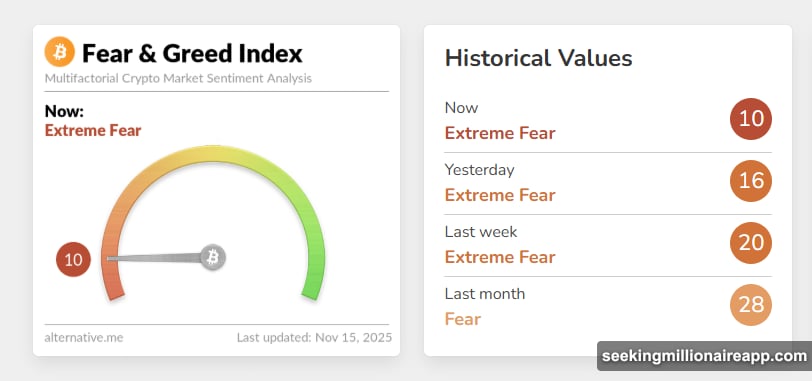
Notice the pattern? Fear keeps accelerating. It’s not stabilizing or bouncing back. That persistent compression signals capitulation, which often precedes extended downtrends.
However, sentiment alone doesn’t confirm anything. It just shows exhaustion. Real bear markets need technical confirmation too.
Bitcoin Lost Its Most Important Support Line
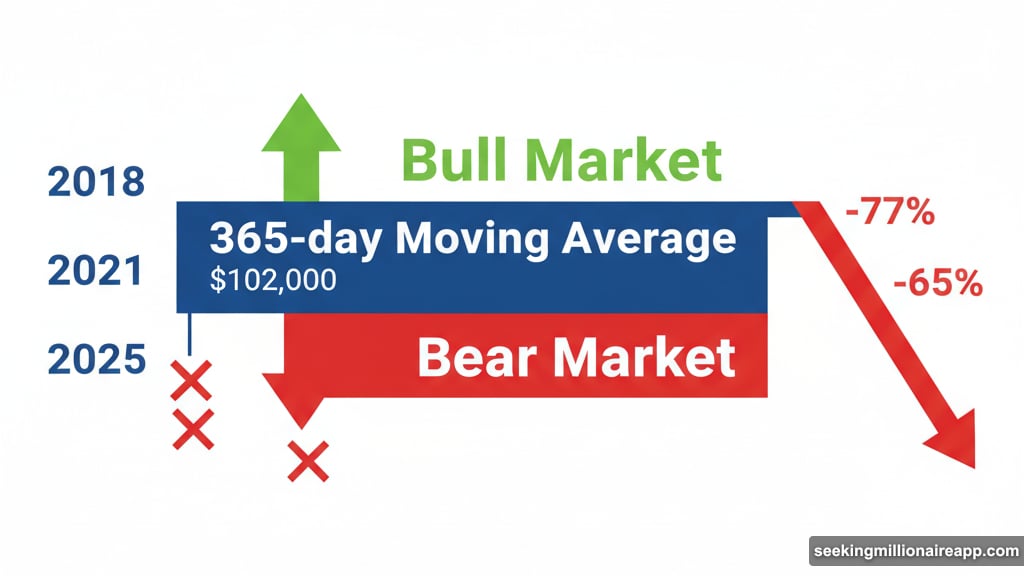
The 365-day moving average matters more than most indicators. It separates bull cycles from bear cycles with remarkable consistency.
Right now, that line sits near $102,000. Bitcoin trades below it. That’s a problem because this breakdown mirrors December 2021 almost exactly. Back then, price lost the same moving average and never recovered. The bear market that followed erased 77% of Bitcoin’s value.
Look at the historical pattern:
2018: Lost 365-day MA → Full bear market
2021: Lost 365-day MA → Full bear market
2025: Just lost 365-day MA → Bear risk rising fast
Failing to reclaim this level quickly almost always confirms a cycle shift. In fact, every sustained break below the 365-day MA since 2014 led to at least a 65% drawdown. So this is arguably the strongest technical argument for a bear transition.
But here’s the catch. We just broke it. Bear markets take weeks below this line to confirm, not days.
The On-Chain Data Shows Early Stress
Bitcoin now trades below the cost basis for 6-12 month holders. These are people who bought during the ETF rally earlier this year. They represent “bull cycle conviction buyers” who expected higher prices.
Their breakeven sits around $94,600. When Bitcoin falls below what this group paid, market structure weakens significantly. That’s because these holders get shaken out, creating selling pressure that feeds on itself.
This happened in 2021 too. Bitcoin dropped below the 6-12 month cost basis in May. Then it kept falling for months as those holders capitulated.
Still, this is the first time we’re seeing cost-basis stress since 2022. That suggests a mid-cycle break rather than a full macro bear trend. At least for now.
The Oversold Readings Tell a Different Story
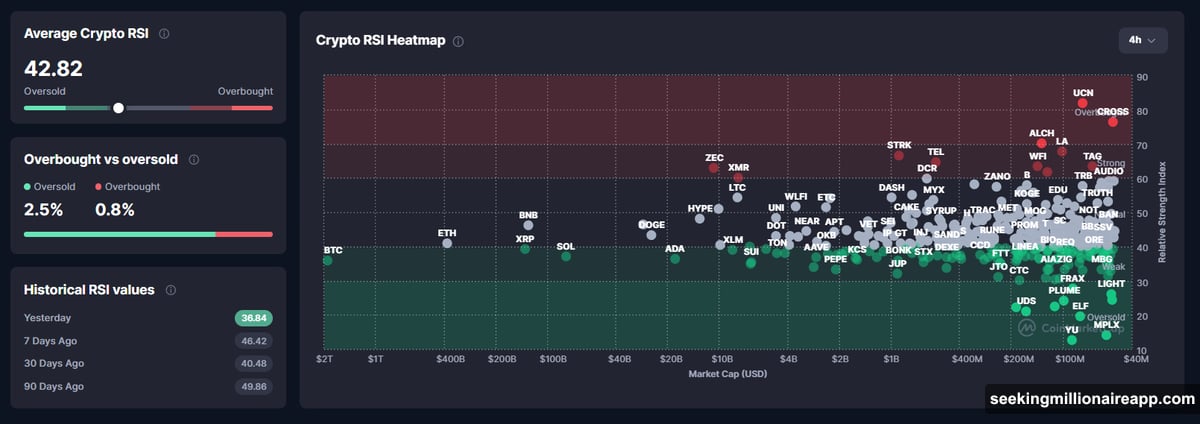
Market-wide RSI shows stress but not devastation. The average crypto RSI sits at 43.09. Bitcoin’s RSI ranks among the lowest in large caps. Meanwhile, only 2.5% of assets are overbought while most are oversold.
These numbers resemble May-July 2021, August 2023, and August 2024. Each period marked mid-cycle corrections, not end-of-cycle bears.
Here’s the difference. When RSI stays deeply oversold for weeks, bearish momentum confirms. Right now, we’re oversold but not stuck there yet. The market could still bounce from these levels.
Moreover, the average MACD (Moving Average Convergence Divergence) stands at 0.02. That indicates weak bullish momentum returning rather than accelerating bearish momentum.
Even more telling? About 58% of market assets show positive momentum. Bitcoin sits deep in negative territory, but altcoins are mixed.
In full bear markets, 90%+ of assets show negative MACD simultaneously. We’re nowhere near that threshold.
Three Conditions That Would Confirm a Bear Market
So when does this shift from correction to confirmed bear? Three specific conditions need to align.
First, Bitcoin must stay below the 365-day MA for 4-6 weeks. This triggered every bear market in 2014, 2018, and 2022. Quick recoveries above this line usually mean the bull cycle continues. Sustained breaks mean the cycle ended.
Second, long-term holders need to keep distributing heavily. If LTH selling exceeds 1 million BTC over 60 days, the cycle top is probably in. We’re seeing some distribution now, but not at panic levels yet.
Third, MACD must flip fully negative across the entire market. When nearly all assets show negative momentum for weeks, that confirms widespread bearish conviction. We’re not there yet since 58% still show positive momentum.
Until all three conditions hit, we’re in a high-risk transition zone. Not quite a bear market, but close enough to hurt.
Nobody Knows What Happens Next Week
Markets don’t move in straight lines. They don’t follow perfect patterns either.
Bitcoin could reclaim $102,000 next week and invalidate the breakdown. Alternatively, it could spend months below long-term support and cement a bear cycle. Both outcomes remain possible.
What matters now is recognizing where we stand. The 365-day MA break puts us in dangerous territory. The on-chain stress shows early capitulation. But the momentum indicators haven’t collapsed completely.
So no, this isn’t 2022 yet. That bear market saw multiple systemic failures, complete momentum collapse, and months of grinding lower. We’re not there.
But we’re one bad month away from it. Watch that 365-day MA closely.