Ethereum is down 24% this month. Yet on-chain data shows the exact same setup that triggered a massive rally in June.
The catch? A deeper drop came first. And that pattern is playing out again right now.
The June Pattern Returns
NUPL tells the story. That’s Net Unrealized Profit/Loss, which tracks how much profit holders are sitting on without selling.
When NUPL drops hard, it clears out weak hands. That reset creates space for a real rally. June proved this perfectly.
Here’s what happened then. On June 5, NUPL hit 0.24. Many called the bottom. ETH bounced to $2,814 by June 10. But that relief rally failed fast.

From June 10 to June 22, NUPL crashed to 0.17. ETH dropped to $2,230. That was a brutal 20.7% drop from the bounce high. Most people gave up.
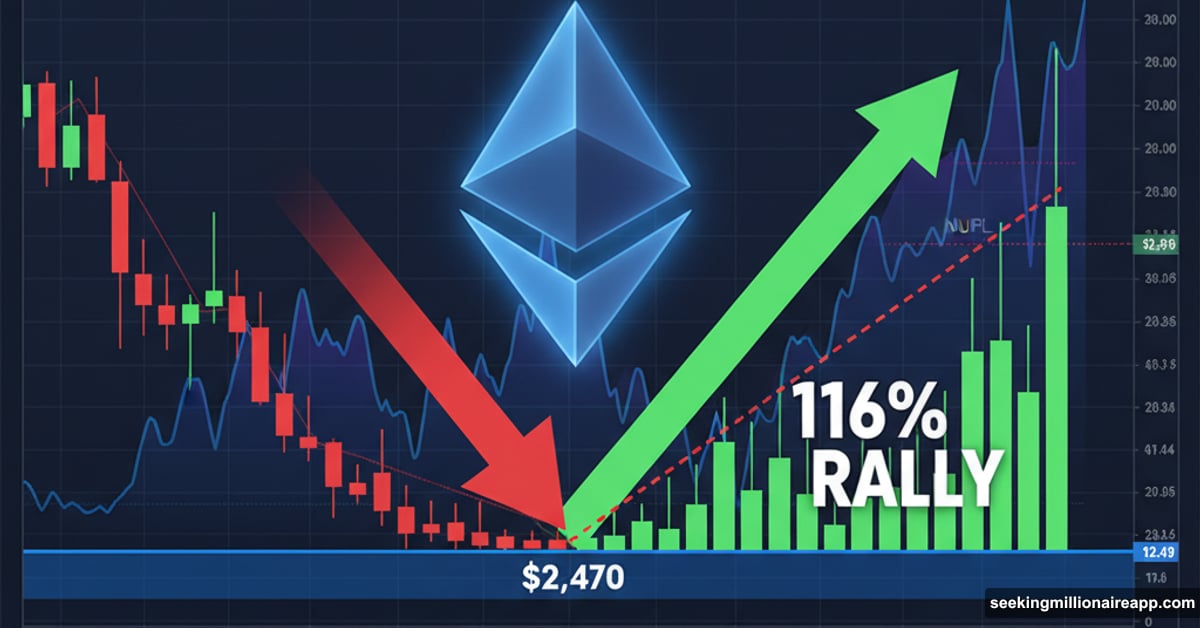
Then the real move started. ETH surged 116% over two months, climbing from $2,230 to $4,829. The reset worked.
Same Setup, Different Month
Fast forward to now. On November 14, NUPL hit 0.24 again. Same exact level as June 5. ETH bounced to $3,115. But the move lacked conviction, just like June 10.
Selling returned immediately. By November 16, NUPL already dropped to 0.21. It’s heading down aggressively toward that same reset zone near 0.17.
If NUPL follows the June path completely, ETH needs to drop another 20.7% from its bounce high. That puts the target near $2,470. So the same cleanup that enabled June’s monster rally might be happening again.

But nobody knows if buyers will show up this time. June worked because conditions shifted after the flush. This time could play out differently.
Exchange Data Confirms Weakness
Exchange flows back up the reset idea. The net position change shows how much ETH moves in or out of exchanges.
On November 6, outflows hit 1.14 million ETH. People were taking coins off exchanges, typically bullish behavior. But by November 17, outflows collapsed to 574,000 ETH. That’s a 50% drop in less than two weeks.
When outflows shrink this fast, holders are selling. Coins stay on exchanges because people don’t want to hold them anymore. That pressure needs to clear before a sustained rally can begin.

Combined with NUPL, exchange activity points toward more downside before any meaningful recovery starts.
Chart Levels Line Up Perfectly
ETH trades inside a downward channel that started in early October. The broader trend remains bearish. And the chart structure points to the same zone as NUPL.
First key level sits at $2,920. Losing this on a daily close confirms sellers remain in control. Below that, the next critical support lands at $2,466.
That’s remarkable. The NUPL reset model projects roughly $2,470. The chart structure shows $2,466. Two completely different methods, same target zone.
When separate systems converge like this, the signal gets harder to ignore. A bounce from $2,466 would make sense. A sustained rally from there would mirror June exactly.

The Waiting Game
ETH could hold $2,920 and bounce from here. That would improve the picture short term. But the structure still leans toward one final flush before a real reversal begins.
Reclaiming $3,655 would invalidate this bottoming scenario for now. But even then, it might just be another weak relief rally like June 10. The real test comes if ETH drops to that $2,466 zone.
History doesn’t repeat perfectly. June’s setup worked because macro conditions shifted after the cleanup. This time, the same pattern is forming. But conditions might not align the same way.
Still, the data is clear. NUPL needs to reset. Exchange flows confirm selling pressure. And chart levels point to the same downside zone. Whether that sets up another 116% rally or just extends the pain remains to be seen.
For now, the pattern says drop first, rally later. The question is whether traders trust history enough to bet on it.