
Ethereum just got more interesting. Large holders accumulated 90,000 ETH this week while the chart forms a textbook bullish pattern.
The second-largest cryptocurrency is up 1% in the past day. That trails Bitcoin’s recent gains, but it cuts Ethereum’s monthly loss to just 5.7%. Meanwhile, Bitcoin sits down more than 10% for December.
More importantly, Ethereum now sits 7% away from confirming a major breakout pattern. And whales are betting it happens.
Cup and Handle Pattern Takes Shape
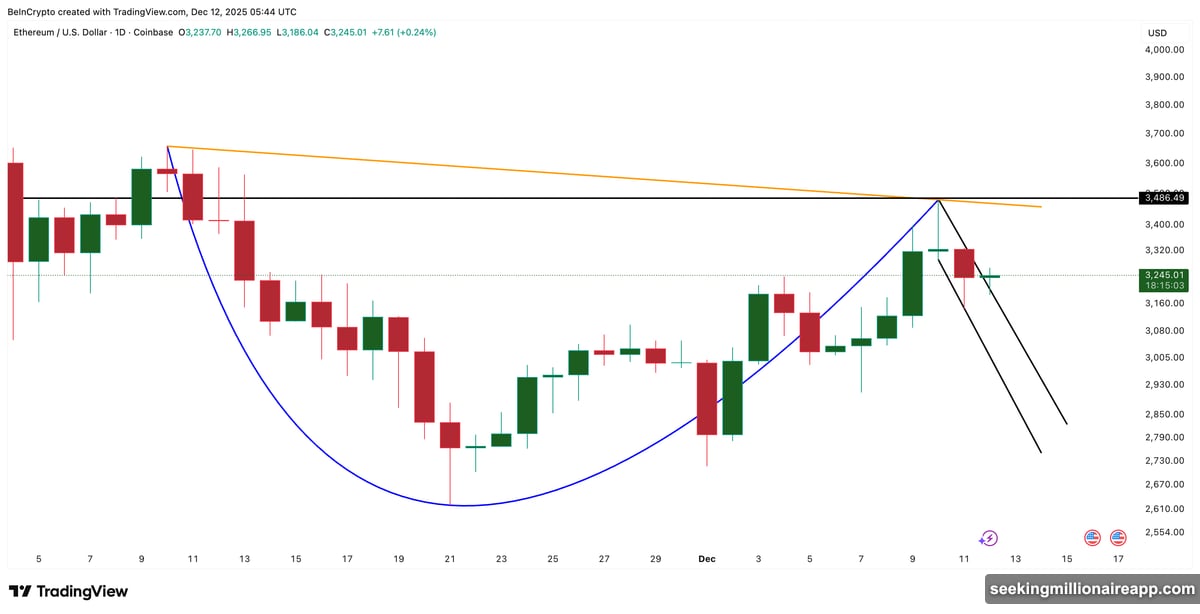
Ethereum is forming a cup and handle structure on the daily chart. This pattern often signals trend reversals when it appears after significant declines.
The “cup” forms from mid-November’s low point. It creates a rounded bottom that shows selling pressure weakening over time. The “handle” is the recent pullback that creates a consolidation zone before the next potential move up.
The pattern’s rim slopes slightly downward. But that doesn’t break its validity. Sloping necklines still work as long as price respects the cup structure and returns to test the rim level.
So far, Ethereum is doing exactly that. The structure remains intact while buyers defend key support zones.
Whales Add 90,000 ETH at Critical Moment
Timing matters in crypto. And whale wallets just made a timely move.
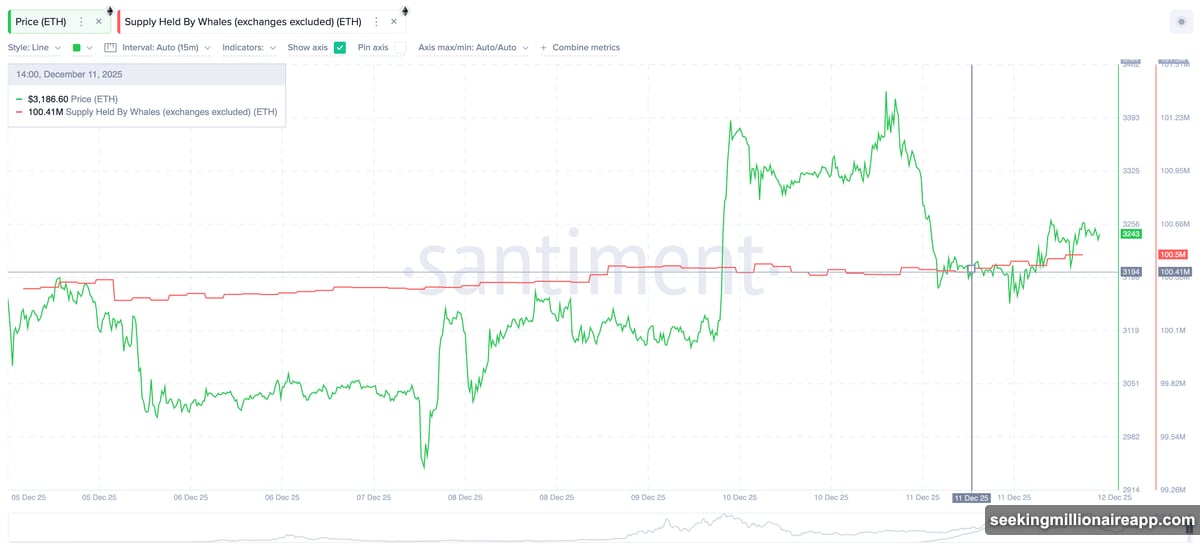
Between December 11 and December 12, whale supply jumped from 100.41 million ETH to 100.50 million ETH. That’s 90,000 ETH added in roughly 24 hours. At current prices near $3,250, that represents approximately $293 million in fresh capital.
This accumulation happened precisely as Ethereum started moving out of the handle portion of its pattern. Large holders typically add positions when they expect continuation moves. Plus, they have access to information and analysis that retail traders often miss.
However, whale buying alone doesn’t confirm breakouts. It simply shows that sophisticated market participants see potential upside forming. The chart still needs to do the heavy lifting.
$3,486 Decides Everything
Right now, Ethereum trades about 7% below its critical breakout level at $3,486. That price represents the neckline of the cup and handle pattern.
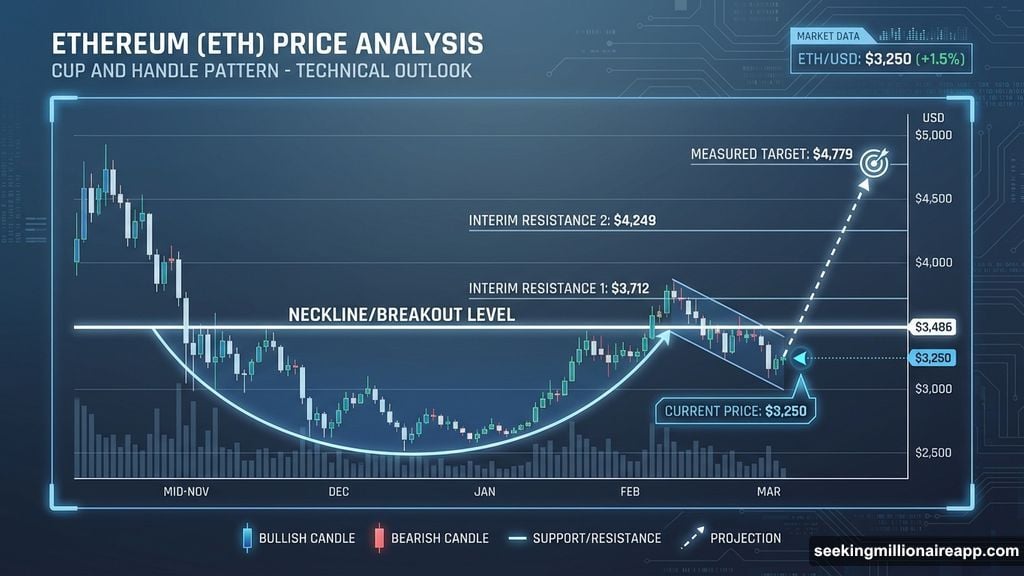
A daily close above $3,486 confirms the structure. It also activates the measured target based on the cup’s depth. That target sits near $4,779, which represents a 37% gain from the breakout point.
Before reaching that level, Ethereum would encounter interim resistance zones. The first appears at $3,712, followed by another at $4,249. These areas historically slow price action because they mark previous supply zones where sellers defended positions.
Each resistance level acts as a checkpoint. Breaking through shows sustained buying interest. Failing at them suggests the move lacks conviction.
Downside Risk Remains Real
Bullish setups always carry downside scenarios. For this pattern, weakness first appears with a daily close under $3,152.
That level marks the bottom of the handle structure. Dropping below it breaks the consolidation pattern and signals that buyers can’t maintain momentum. The entire setup gets invalidated if Ethereum falls below $2,620, which marked the cup’s bottom.
Those downside levels matter as much as upside targets. They define where the bullish thesis fails and help traders manage risk appropriately.
What Changed Recently
Ethereum’s December started rough. It dropped more than 15% in the first week while Bitcoin fell harder. That selling pressure created the handle portion of the current pattern.
But something shifted in the past few days. Buying pressure increased at lower levels. The chart stopped making new lows. Then whales started accumulating.
Now the structure sits just below its breakout point. The setup looks stronger than it has in weeks, even though confirmation is still pending.
Three Scenarios From Here
First scenario: Ethereum breaks above $3,486 with volume. That confirms the pattern and opens the path toward $3,712, then $4,249, and eventually the full target near $4,779. Each resistance level would slow progress, but the overall bias shifts bullish.
Second scenario: Ethereum consolidates between $3,152 and $3,486 for several more days or weeks. The pattern remains valid but unconfirmed. Traders wait for resolution while whales potentially add more positions if they see continued value.
Third scenario: Ethereum drops below $3,152 and breaks the handle structure. The bullish thesis fails and focus shifts to defending $2,620. Below that level, deeper support zones come into play around $2,200.
Why This Setup Feels Different
Cup and handle patterns appear frequently in crypto charts. Most fail. So what makes this one worth watching?
Three factors stand out. First, the pattern formed after Ethereum fell from its March highs near $4,000. That gives it significance as a potential reversal structure rather than just a continuation pattern.
Second, whale accumulation during the breakout attempt shows sophisticated money entering. Large holders don’t time every move perfectly, but their participation adds weight to technical setups.
Third, Ethereum has defended its handle support multiple times in recent days. That shows buyers stepping in at lower levels rather than letting price drift toward the invalidation zone.
None of these factors guarantee success. But they stack the odds differently than typical technical patterns that form in isolation.
Bitcoin’s Influence Matters
Ethereum rarely breaks out while Bitcoin crashes. The two assets move together most of the time, especially during volatile periods.
Bitcoin currently sits near $97,000 after pulling back from recent highs. It’s down more than 10% for December and showing some weakness in its own chart structure. If Bitcoin continues lower, Ethereum faces headwinds regardless of its individual pattern.
However, Bitcoin has also found support in the $95,000-$97,000 range multiple times this week. If that level holds and Bitcoin stabilizes, Ethereum gets room to attempt its breakout without fighting the broader market tide.
The next few days determine whether Bitcoin gives Ethereum the breathing room it needs. Or whether broader crypto weakness drags both assets lower regardless of individual setups.
Next Seven Days Define the Trade
Ethereum doesn’t need months to resolve this pattern. The next week shows whether this breakout has legs.
Watch for a daily close above $3,486. That confirms the structure and shifts the bias clearly bullish. Then watch how price behaves at $3,712. Clean breaks suggest momentum. Rejections suggest the move lacks follow-through.
If Ethereum fails to break $3,486 and instead drops toward $3,152, the setup weakens significantly. Below that level, the pattern breaks and the focus shifts to defending deeper support.
The chart is close to making its move. Whales just added $293 million worth of positions. The pattern sits intact just below its breakout point. Now it’s just a matter of whether buyers can push through that final 7% to confirm the next leg up.