
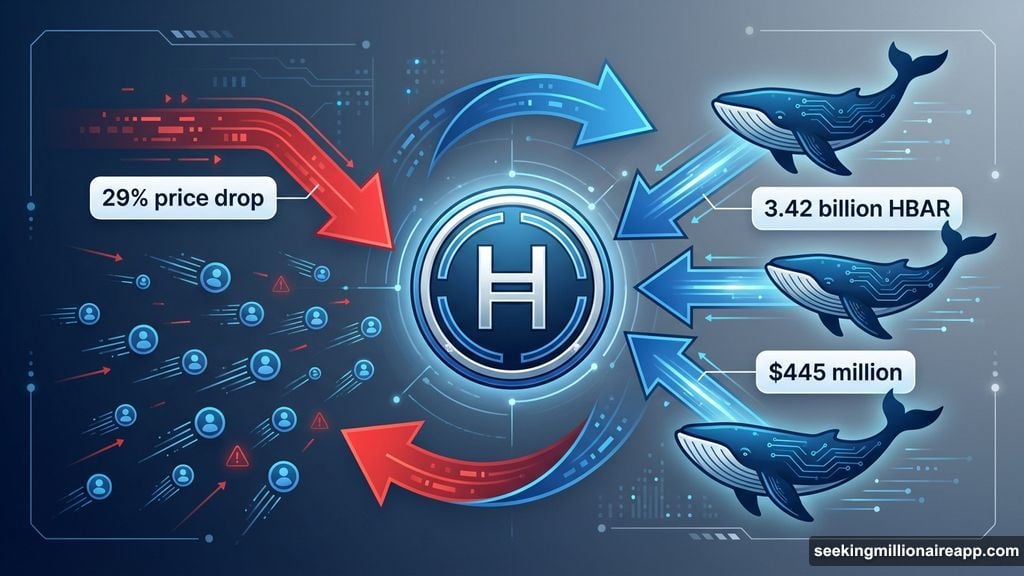
HBAR just dropped 29% this month. Most traders ran for the exits. But whales did the exact opposite.
Large holders added 3.42 billion HBAR tokens over 48 hours while retail investors sold off. That’s roughly $445 million worth of accumulation at current prices. So what are these whales seeing that everyone else missed?
The answer lies in competing signals that create opportunity when most people only see risk.
Two Charts Telling Opposite Stories
HBAR trades inside a falling wedge pattern right now. Wedges typically signal bullish reversals because they show selling pressure weakening over time. But there’s a problem.
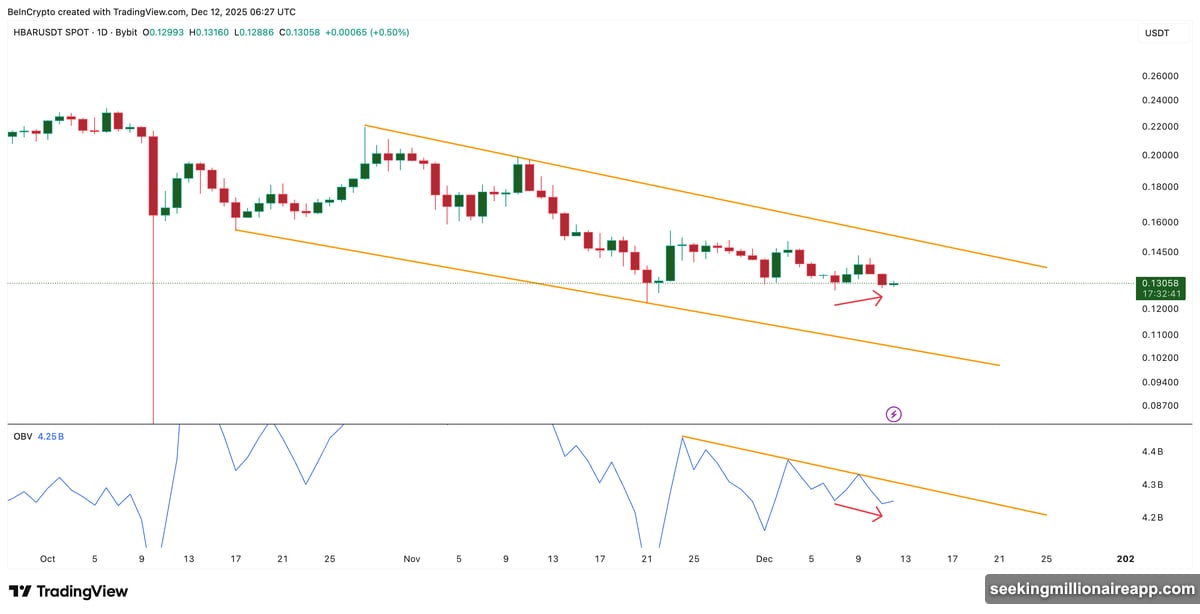
Between December 7 and December 11, price made a higher low while the On-Balance Volume indicator made a lower low. OBV tracks cumulative buying and selling pressure across exchanges. When price bounces but OBV drops, it means buyers lack the strength to sustain momentum.
That’s a bearish divergence. It suggests retail demand is weak even as price tries to stabilize.
Yet whale wallets tell a completely different story. Accounts holding at least 10 million HBAR jumped from 136.54 to 149.49 in under two days. Wallets with 100 million or more HBAR climbed from 40.65 to 73.62 during the same period.
These aren’t small moves. Large holders are absorbing supply aggressively while exchange volume shows weakness. That disconnect matters because OBV mainly captures exchange activity. Big off-exchange transfers and OTC deals often don’t show up in volume indicators.
So whales are buying where retail can’t see it.
The Signal Whales Are Trading On
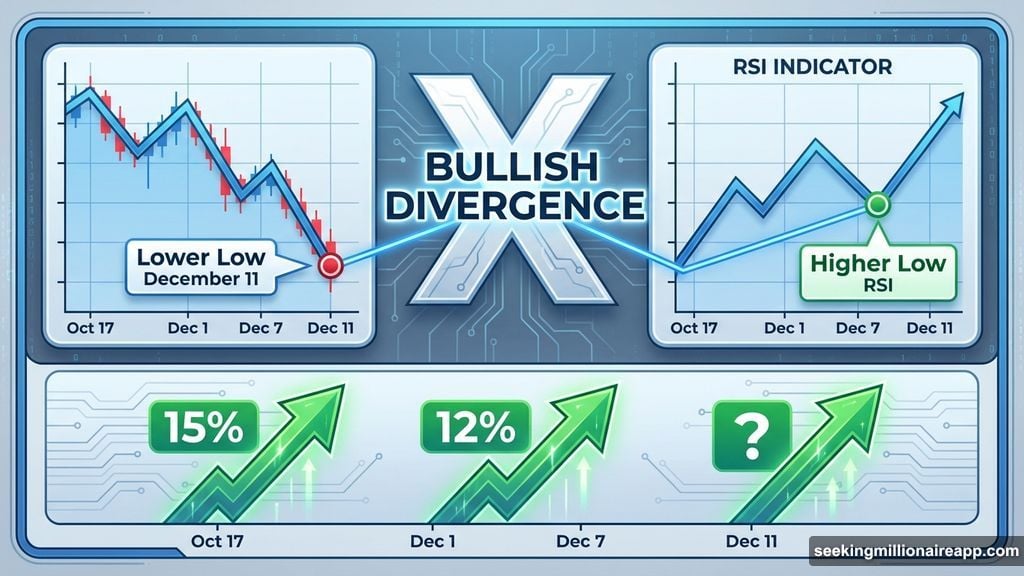
There’s a deeper technical pattern that explains the whale accumulation. Between October 17 and December 11, HBAR made a lower low while the Relative Strength Index made a higher low.
RSI measures momentum by comparing recent gains to recent losses. When price falls but RSI rises, it creates a bullish divergence. This pattern historically appears before trend reversals.
HBAR showed this same setup twice before in recent weeks. On December 1 and December 7, bullish RSI divergences led to rallies of 15% and 12% from local lows. Both moves stalled at resistance levels. But neither had massive whale accumulation happening at the same time.
This attempt is different. The RSI divergence is stronger. Plus, whales are positioned at the lows with billions of tokens. That combination makes this reversal setup more credible than the previous failed attempts.
If resistance levels that stopped earlier rallies break this time, the structure shifts from bearish to bullish. Whales seem to be betting that shift happens soon.
The Make-Or-Break Price Level
HBAR needs a daily close above $0.159 to confirm strength. Previous bounces couldn’t break through that level. A move above it also breaks the upper trendline of the falling wedge pattern.
That opens room for HBAR to test $0.198 next. If momentum continues, $0.219 becomes the target. Breaking $0.159 would validate the whale accumulation and turn it from a background signal into a major catalyst.
On the downside, $0.122 is the critical support. A drop below that level sends HBAR back to the wedge’s lower boundary. That trendline is weak because it only has two touch points so far. Breaking below it means sellers still control the broader trend and delays any meaningful recovery.
Right now HBAR sits between these two levels. OBV shows retail is cautious. RSI shows reversal conditions are building. And whales just deployed nearly half a billion dollars at depressed prices.
What Smart Money Knows That Most Don’t
Whale accumulation during retail capitulation is a classic setup. It doesn’t guarantee immediate gains. But it shifts risk-reward heavily in favor of patient holders.
These large buyers likely see the RSI divergence playing out on a longer timeframe than most retail traders watch. They’re also comfortable sitting through short-term volatility because their average entry is significantly lower than recent prices.
The falling wedge pattern adds technical confirmation. Wedges resolve bullish about 68% of the time according to historical data. Combined with whale positioning and momentum divergence, this setup has multiple factors working together.
But none of it matters unless $0.159 breaks. That’s the line that separates hopeful accumulation from confirmed reversal. Watch how HBAR reacts at that level over the next few sessions.
If whales are right, this weakness becomes a launchpad. If they’re wrong, those billions of tokens get trapped underwater for longer. Either way, their positioning suggests they’re betting on strength ahead, not more pain.