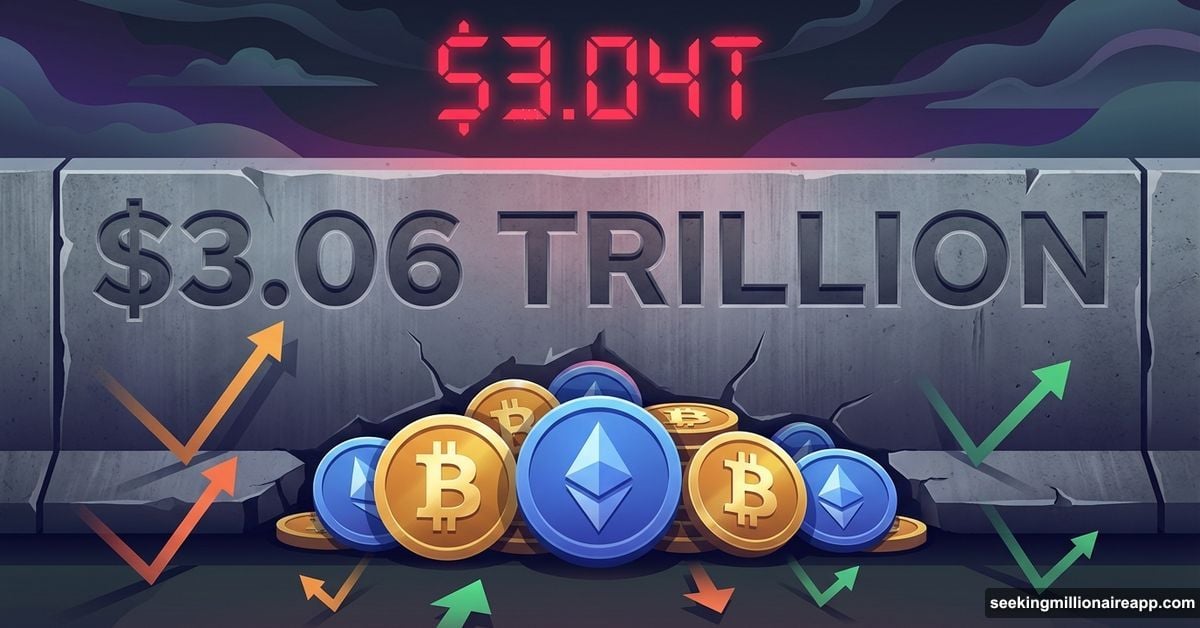
The crypto market looks dead on the surface. Bitcoin barely moved. Ethereum inched up slightly. Total market cap sits near $3.04 trillion.
But underneath that calm exterior, something important just happened. A new resistance level formed that’s keeping the entire market stuck in place.
Let’s break down what’s actually going on and whether this stall signals trouble ahead.
The $3.06 Trillion Wall Nobody Expected
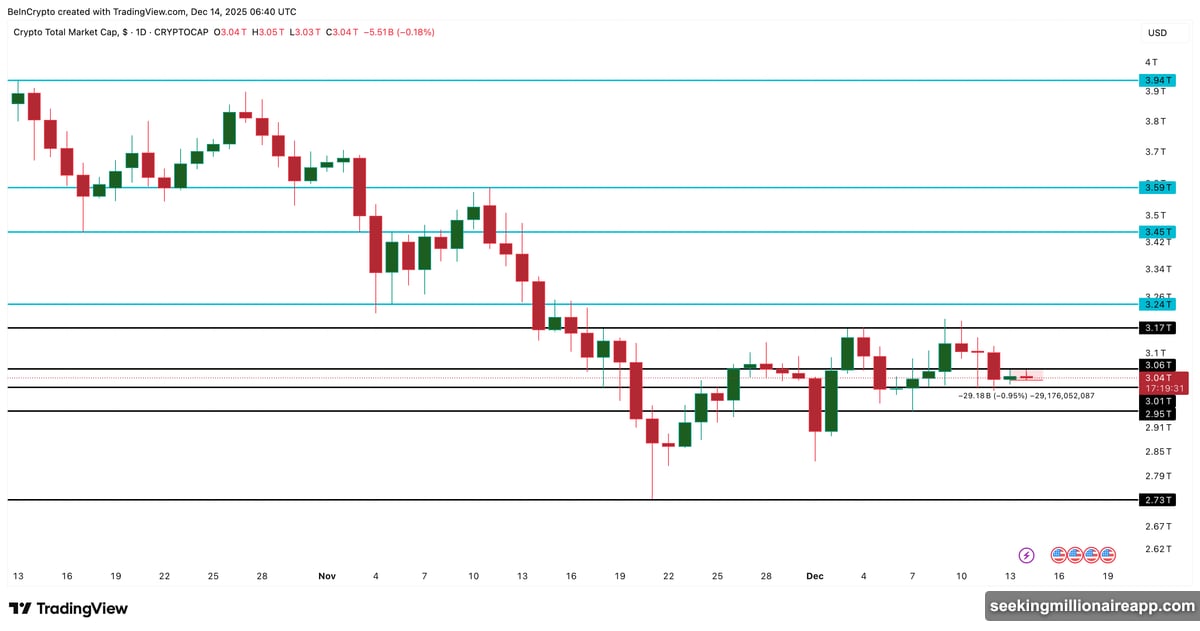
Over the past several sessions, total crypto market cap repeatedly failed to close above $3.06 trillion. Each attempt met immediate selling pressure.
This level wasn’t significant before. Now it’s become a clear resistance zone where buyers and sellers battle without either side winning. That’s why the market looks weak despite losing only 0.95% from yesterday’s high.
The pattern matters more than the percentage. When a market this size can’t push through a specific level multiple times, it signals hesitation rather than strength. Plus, the failed attempts show buyers aren’t convinced enough to commit capital above that threshold.
Brazil’s largest private bank just advised clients to allocate up to 3% of portfolios to Bitcoin. Meanwhile, the market can’t break through a technical level that’s been tested repeatedly over just a few days. That disconnect tells you something about short-term sentiment versus long-term conviction.
Bitcoin Moves Sideways, But Volume Tells Different Story
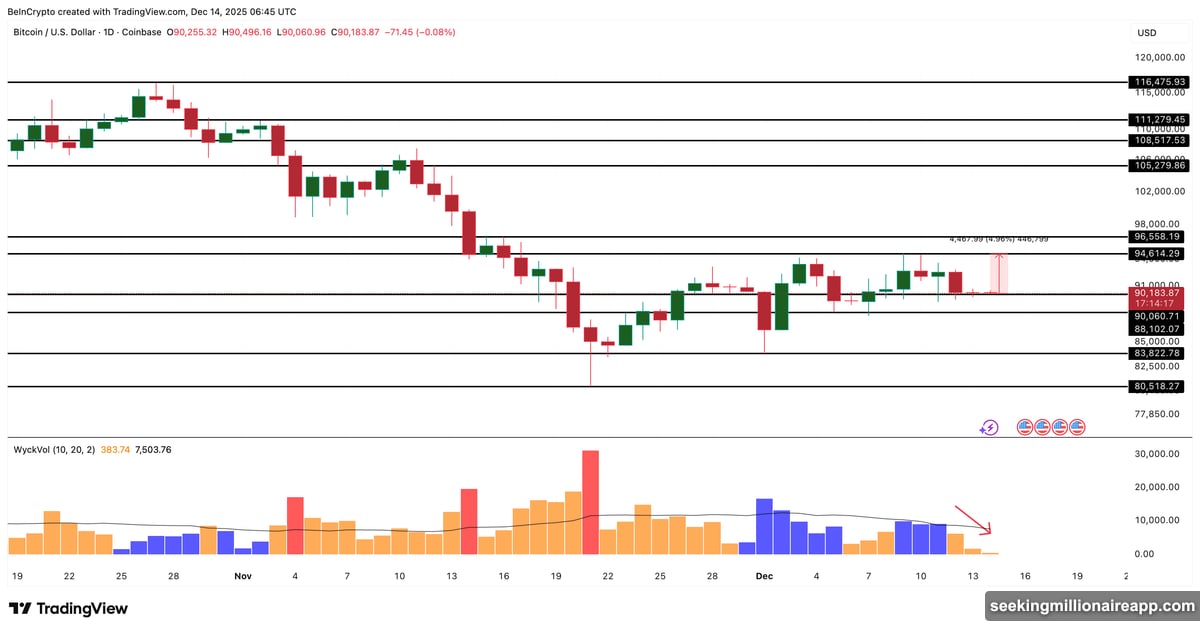
Bitcoin traded nearly flat over 24 hours. Down just 0.2%, it’s been painting small, indecisive candles near $90,200.
However, the volume behavior beneath those candles reveals a shift. Selling pressure is quietly fading.
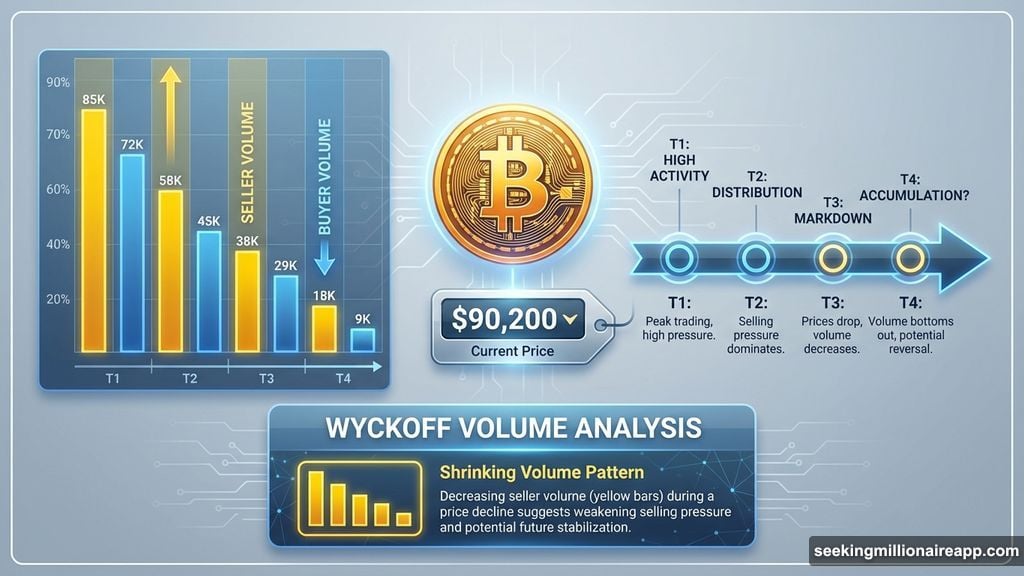
Using Wyckoff-style volume analysis, yellow bars represent seller-led activity while blue bars show buyer control. Those yellow bars have been shrinking consistently. Sellers are still present, but they’re no longer pushing prices lower with conviction.
This doesn’t guarantee an immediate breakout. Yet when selling weakens without price collapsing, it often sets the stage for a directional move once buyers actually step in. The 30-day performance still shows Bitcoin down nearly 8%, so momentum hasn’t returned. But the underlying pressure may be easing.
The first meaningful level is $94,600. A daily close above it would mark roughly 5% upside from current prices and signal buyers regained short-term control. Until then, Bitcoin remains range-bound with decreasing sell pressure rather than increasing buy interest.
Why Zcash Dropped 9% While Everything Else Stayed Flat
Zcash emerged as one of the biggest losers among large caps, sliding over 9% while most assets barely moved. That sharp divergence looks alarming at first glance.
The reason behind the drop is actually structural, not bearish. Zcash maintains a negative correlation with Bitcoin over the past year. When Bitcoin stalls and volatility compresses, Zcash historically experiences sharper pullbacks.
Pearson correlation data confirms this inverse relationship. So Zcash weakness during a period of market quietness makes sense given the asset’s behavior pattern. Moreover, the price chart doesn’t show breakdown signals. Instead, Zcash appears to be consolidating after a strong 24% weekly rally.
Price action is compressing into what looks like the early formation of a bull flag pattern. While not confirmed yet, this suggests Zcash is digesting gains rather than entering a new downtrend. For momentum to return, the asset needs to reclaim $475, about 11.5% higher than current levels.
A sustained break above $434 would strengthen the bullish case and open a projected path toward $685. That’s roughly 57% higher than the breakout base. On the flip side, losing the $368 level would weaken the structure and favor sellers again.
Institutional Money Keeps Accumulating Despite Stagnation

While retail traders watch prices stall, institutional players continue accumulating. Tom Lee’s BitMine just purchased another 23,637 ETH worth approximately $73 million.
That’s not small money entering during a consolidation phase. On-chain data shows this continued institutional accumulation even as the broader market struggles with resistance. This behavior suggests large players view current prices as attractive entry points rather than concerning stall zones.
Meanwhile, Tether’s $1.3 billion bid to acquire Juventus FC got unanimously rejected by the Agnelli family’s holding company. That rejection underscores limits to crypto capital’s expansion into traditional sports assets. But it doesn’t change the underlying accumulation pattern happening on exchanges.
The disconnect between institutional behavior and short-term price action often precedes major moves. When large players accumulate while retail sentiment remains cautious, it creates conditions for eventual upside once resistance breaks.
What Happens Next Depends on These Levels
The market structure is clear even if direction isn’t. For the total crypto market cap, a daily close above $3.06 trillion would ease near-term pressure and open the path toward $3.17 trillion.
Failure to reclaim that level keeps the market vulnerable. On the downside, a break below $3.01 trillion would weaken the structure and expose $2.93 trillion as the next support. Deeper selling could push toward $2.73 trillion if momentum shifts bearish.
Bitcoin needs to clear $94,600 to signal buyers regained control. That would likely provide support to the broader market. Until then, the asset remains range-bound with fading sell pressure but no confirmed buyer interest yet.
For Zcash and other negatively correlated assets, Bitcoin’s directional move matters most. If BTC breaks higher, expect ZEC and similar assets to face additional near-term pressure before their own patterns resolve.
The Market Isn’t Broken, Just Stuck
This isn’t a market in crisis. It’s a market in transition.
Selling pressure is weakening. Institutional accumulation continues. Yet resistance holds firm enough to prevent upward progress. That combination creates frustration but not necessarily danger.
The next few sessions determine whether buyers can reclaim control or sellers force a deeper correction. Watch the $3.06 trillion level on total market cap and $94,600 on Bitcoin. Those levels separate consolidation from either breakout or breakdown.
One thing’s certain: this stall won’t last forever. Markets don’t consolidate indefinitely. Either buyers push through resistance or sellers force a retest of lower support. My bet? The fading sell volume suggests buyers are closer to winning this standoff.