
Ethereum just scored major institutional validation. Yet the price keeps sliding.
JPMorgan launched its first tokenized money market fund on Ethereum this week, seeding it with $100 million before opening to outside investors. That’s the world’s largest bank by market cap choosing Ethereum as settlement infrastructure.
So why is ETH down 11% since December 10? And more importantly, can this institutional backing stop the bleeding, or will technical pressure force a deeper breakdown?
The JPMorgan Move Changes Nothing Right Now
Let’s be clear about what this means. JPMorgan’s tokenized fund, called MONY, runs entirely on Ethereum. The bank picked Ethereum over every other blockchain for real financial products handling real institutional money.
That’s huge for long-term credibility. Traditional finance increasingly treats Ethereum as the infrastructure layer for tokenized assets. In fact, this follows similar moves from BlackRock and Franklin Templeton, both of which launched tokenized funds on Ethereum in recent months.
But here’s the catch. None of that institutional interest translates to immediate price support. The $100 million JPMorgan allocated doesn’t buy ETH tokens directly. Instead, it backs a fund that settles transactions on Ethereum’s network.
Plus, the fund launches Tuesday for outside investors. So any potential price impact from actual ETH purchases for gas fees or liquidity remains weeks or months away. Meanwhile, ETH faces immediate technical pressure that no headline can fix.
Technical Breakdown Threatens $2,620 Support
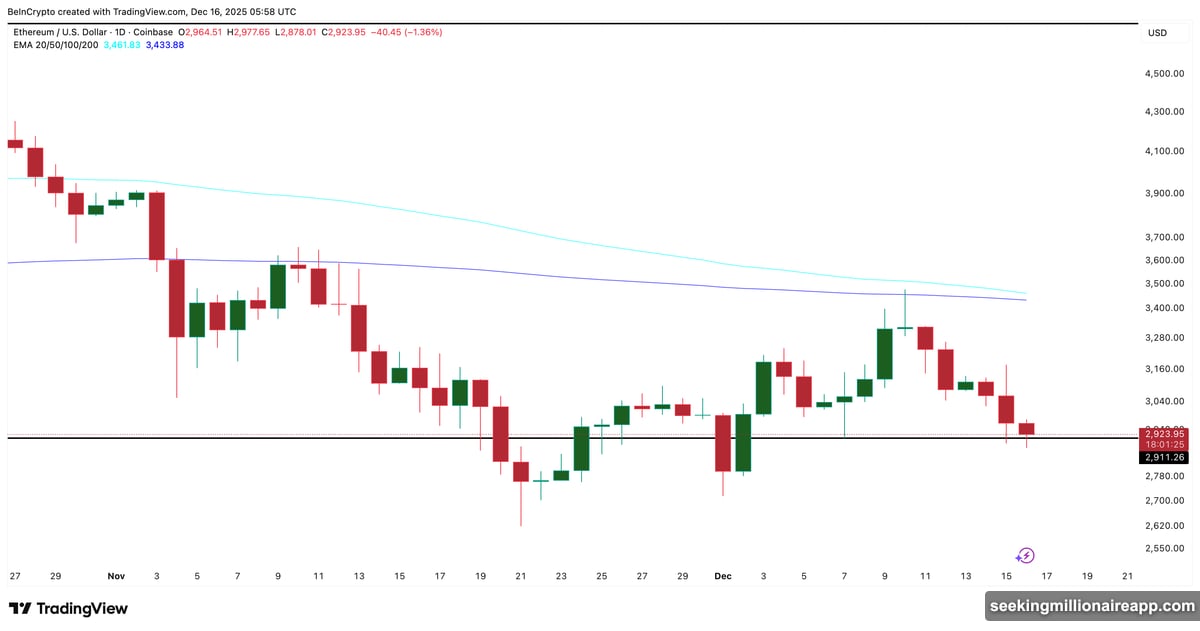
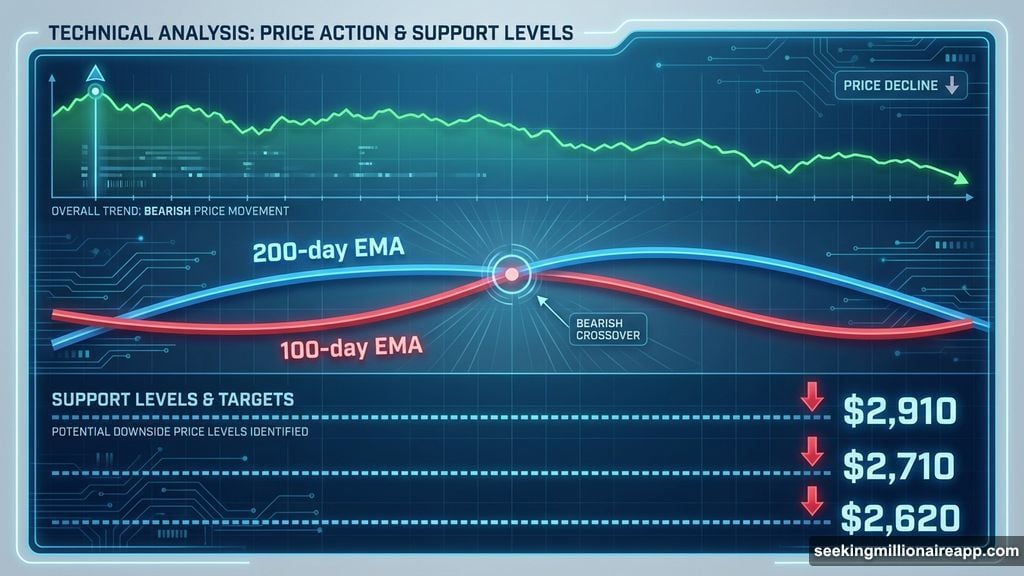
Ethereum’s daily chart shows concerning weakness. The 100-day exponential moving average is about to cross below the 200-day EMA, forming what traders call a “death cross.”
This matters because EMAs track price momentum. When the faster 100-day average drops below the slower 200-day average, it signals weakening trend strength. Historically, this setup precedes extended downtrends unless buyers step in aggressively.
Moreover, ETH now tests critical support at $2,910. Holding this level is essential. A daily close below $2,910 would invalidate any rebound scenario and expose downside toward $2,710, followed by $2,620 if selling pressure intensifies.
The macro environment isn’t helping either. Bitcoin’s recent weakness dragged the entire crypto market lower, triggering liquidations that amplified ETH’s decline. In the past 24 hours alone, over $150 million in Ethereum long positions got liquidated, adding fuel to the selloff.
So the chart paints a clear picture. Without a decisive move above $3,240, any bounce should be treated as corrective, not trend-reversing.
On-Chain Data Hints at Potential Rebound Zones
Here’s where things get interesting. While the price chart looks bearish, on-chain metrics suggest Ethereum reached zones where buyers historically stepped in.
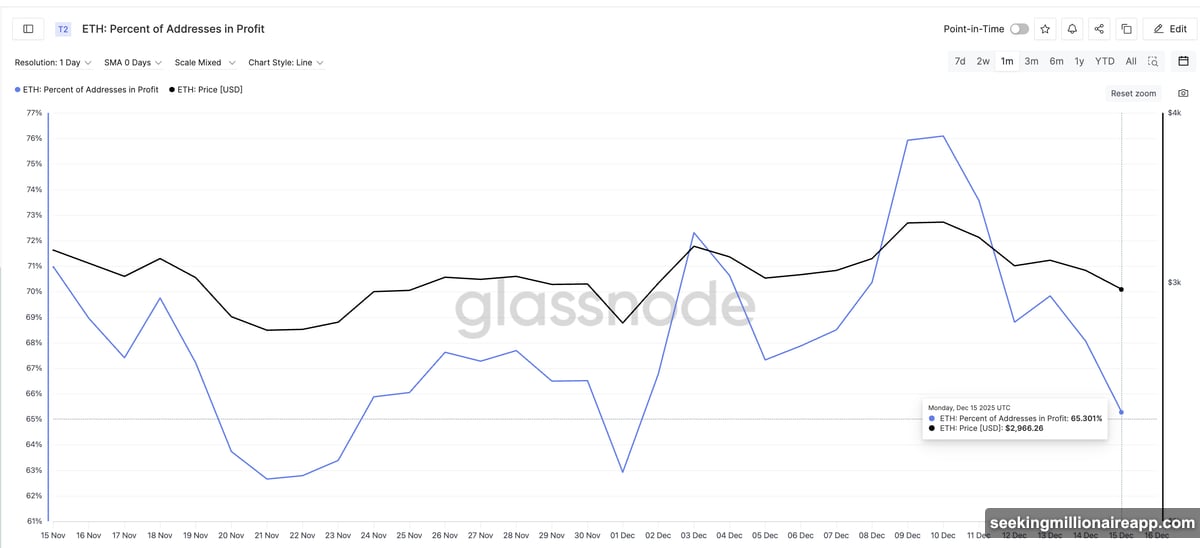
The percentage of Ethereum addresses in profit has dropped sharply since December 10. This metric now sits at its lowest reading since early December. In the past, similar local lows preceded short-term rebounds.
Take December 1. When this metric bottomed that day, ETH rallied from around $2,800 to $3,190 in just 24 hours, roughly a 14% gain. Another local low on December 5 was followed by a near 10% increase.
Does that guarantee a bounce this time? Absolutely not. But it shows selling pressure reached levels where buyers previously found value, at least temporarily.

Plus, exchange outflows have started ticking up, suggesting some investors are moving ETH off exchanges into cold storage. That’s typically a sign of longer-term holding rather than preparation to sell.
Still, on-chain data only matters if price support holds. If ETH breaks below $2,910 decisively, these metrics become irrelevant in the short term.
The Critical Levels That Decide Everything
Ethereum now faces a binary setup. Two price levels will determine whether institutional headlines can spark a rebound or whether technical pressure forces a deeper breakdown.
Support: $2,910
This is the line in the sand. A daily close below this level invalidates the rebound case and opens the door to $2,710, followed by $2,620 if market stress continues. At $2,620, ETH would be down roughly 25% from its early December high near $3,500.
Resistance: $3,240
For bulls to regain control, ETH must reclaim $3,240 with a daily close above that level. That would ease immediate downside pressure and open the path toward $3,440. Until then, any upside should be viewed as corrective, not trend-confirming.
The macro backdrop adds another layer of uncertainty. If Bitcoin continues struggling near $100,000 and broader risk assets remain under pressure, Ethereum faces an uphill battle regardless of institutional news.
Long-Term Optimism Meets Short-Term Reality
Here’s my take. JPMorgan’s Ethereum fund is legitimately bullish for the next 12-24 months. It validates Ethereum’s role as the settlement layer for tokenized traditional assets. That narrative will matter eventually.
But eventually isn’t now. In the immediate term, price action matters more than headlines. The chart shows clear weakness, and until ETH reclaims $3,240, the path of least resistance remains down.
Watch $2,910 support closely this week. If it holds and on-chain metrics align with a bounce, we could see a quick move toward $3,100-$3,200. But if it breaks, expect further downside toward $2,620 before buyers step in decisively.
The institutional thesis for Ethereum remains intact. The technical setup remains fragile. Both things can be true at the same time.