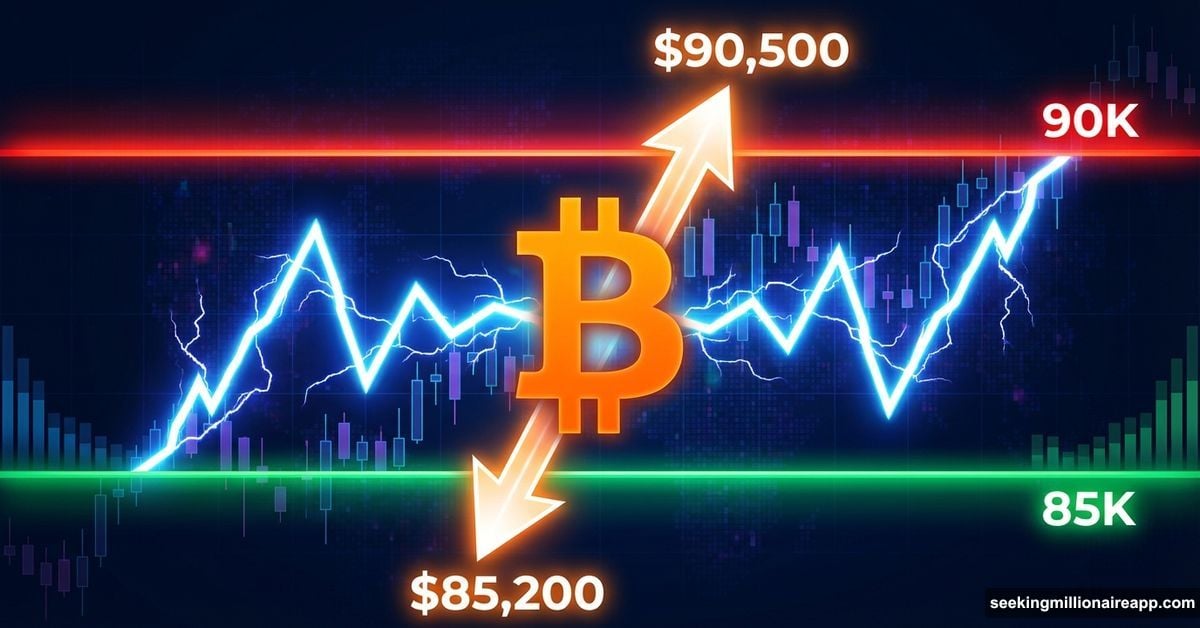
Bitcoin just whipsawed traders with a brutal $5,000 swing in a single day. The move looked chaotic. But it wasn’t.
On December 17, BTC surged toward $90,500 before crashing back to $85,200. That’s a 5% swing that liquidated positions on both sides. Yet three key charts explain exactly why this happened, where it stopped, and why similar violence could return soon.
Volume Data Screamed Warning Before the Drop
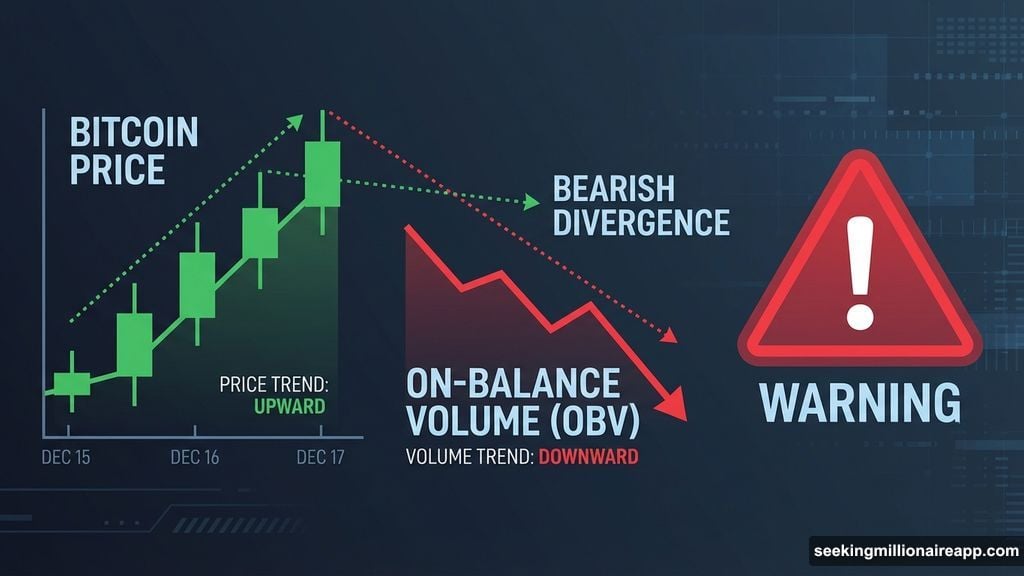
The setup started days earlier. Between December 15 and 17, Bitcoin’s price chart showed stability. The daily candles printed a marginal higher low. That looked healthy on the surface.
But On-Balance Volume told a different story. OBV tracks whether volume confirms price moves. During this period, OBV failed to follow price higher. Instead, it made a lower low while price held steady.
That’s bearish divergence. Price was holding up, but volume was quietly flowing out. In other words, distribution was happening beneath the surface.
So when Bitcoin pushed toward $90,500, it did so with weak participation. The rally was fragile. Once selling started, there was no volume support beneath. That turned a normal pullback into a sharp intraday collapse.
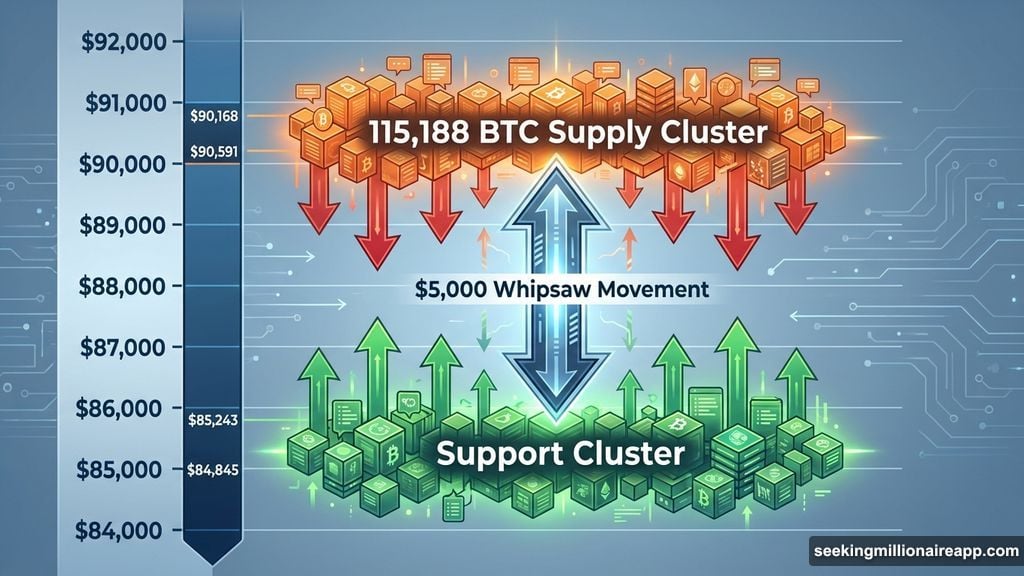
Supply Clusters Show Why $90,500 Rejected Hard
Cost basis data reveals the exact turning points. On-chain heatmaps show a dense supply cluster between $90,168 and $90,591. Around 115,188 BTC were accumulated in this zone.
When price revisited this range, many holders reached break-even. That created immediate sell pressure. Combined with OBV weakness, this cluster acted like a ceiling. The rally stalled, then reversed violently.
Moreover, this wasn’t the first rejection here. Bitcoin failed to hold above $90,500 since December 13. That makes it a proven resistance zone backed by real supply.
The pattern is clear. Holders accumulated near $90,500 and waited for price to return. When it did, they sold into strength. That’s why the reversal was so sharp.
Support Cluster at $85,200 Stopped the Collapse
The downside story is different. Another strong cluster sits between $84,845 and $85,243. This is the most concentrated near-term support zone on the chart.
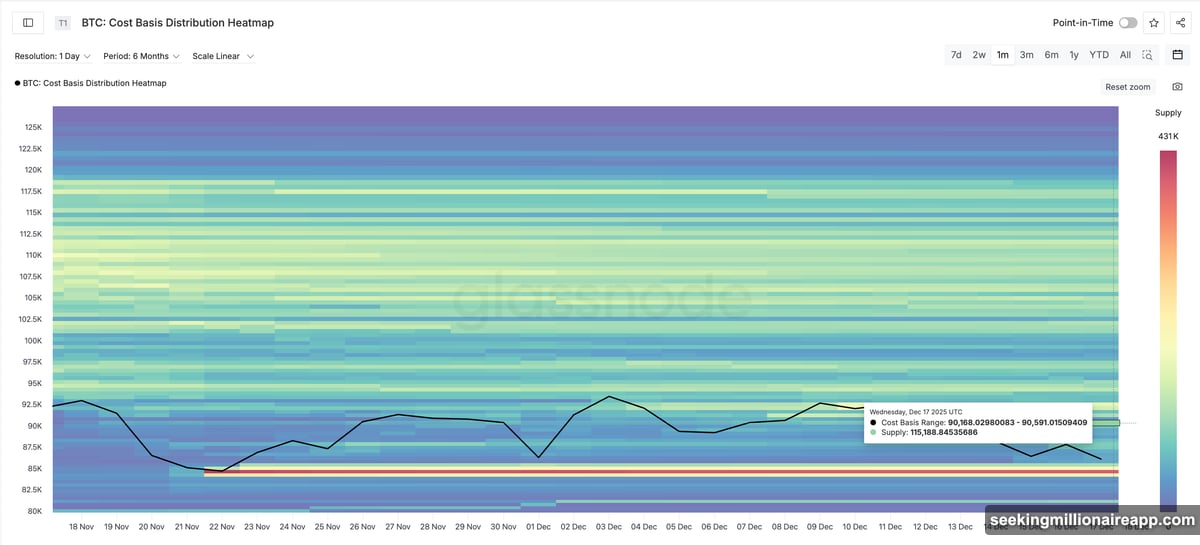
As price fell, buyers stepped in aggressively here. That’s why Bitcoin didn’t collapse further, even during forced liquidations. This zone represents significant cost basis accumulation.
So the move was boxed in. Sellers defended $90,500. Buyers defended $85,200. The whiplash happened inside those walls. Neither side could break through.
This creates a tight range. Until one of these levels breaks decisively, expect continued volatility. The structure is set up for sharp moves in both directions.
Two Levels Now Decide What Happens Next
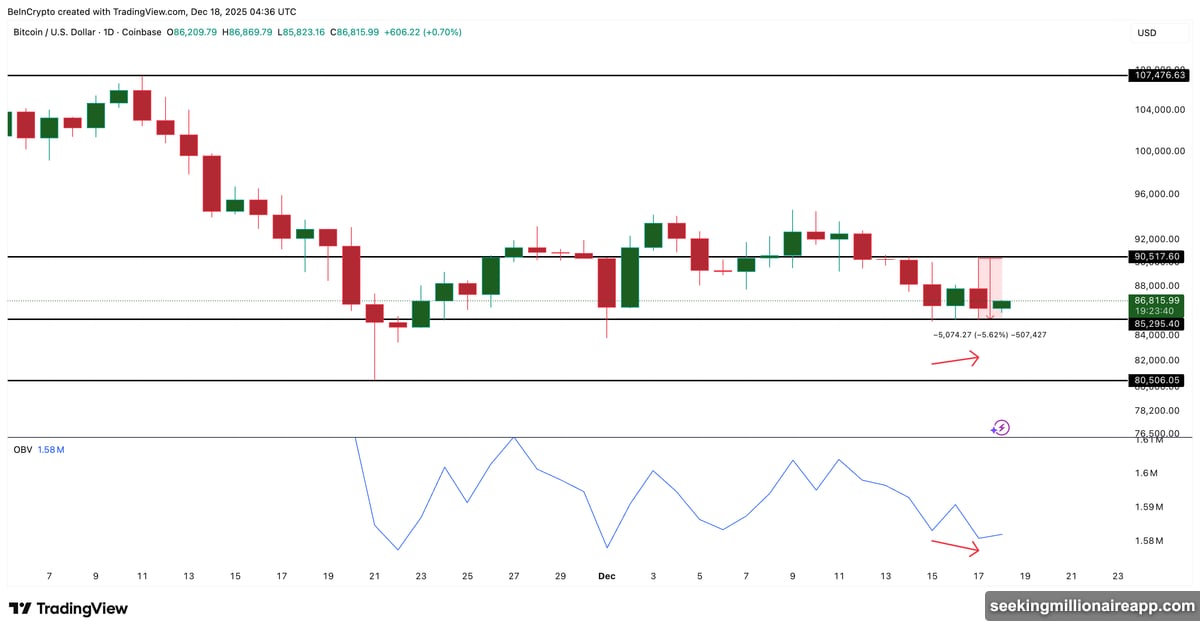
Structurally, Bitcoin is still holding a mild uptrend from the November 21 low. That matters. Yesterday’s volatility event was inside the range, not a trend break.
For upside continuation, one level stands out. Bitcoin must post a clean daily close above $90,500. Not a wick. Not an intraday spike. A full daily candle close.
Above that, $92,200 to $92,300 becomes critical. On-chain data shows another supply cluster there. Traders should expect friction unless price clears that zone decisively.
On the downside, $85,000 to $85,200 remains the key zone. As long as this cluster holds, deeper downside is less likely. A failure there would expose $83,800.
But breaching $85,000 would require fresh liquidation pressure. Right now, buyers are defending aggressively. That support needs to crack before a real breakdown happens.
Why This Pattern Keeps Repeating
Bitcoin’s market structure creates these whipsaw events. Large holders accumulate at specific levels. Those levels show up as cost basis clusters on-chain.
When price revisits these zones, those holders make decisions. Take profit? Add more? Hold? Those decisions create supply and demand walls.
Plus, weak volume makes things worse. When rallies happen without strong participation, they become vulnerable. One wave of selling can cascade into forced liquidations.
That’s exactly what happened at $90,500. The rally was weak. Supply was heavy. Volume couldn’t support higher prices. So the reversal was violent.
Trading This Range Requires Discipline
Until structure changes, sharp moves like this remain normal. The takeaway is simple. Watch $90,500 and $85,200. Those levels control near-term direction.
Above $90,500, the path opens toward $92,200. Below $85,000, downside risk increases toward $83,800. Inside that range? Expect chop and volatility.
Also, pay attention to volume. If Bitcoin attempts another rally without OBV confirmation, be skeptical. Weak rallies fail at resistance.
For now, traders should wait for clean breaks. Don’t chase inside the range. Let price prove it can hold above $90,500 or break below $85,000 before committing to direction.
Bitcoin’s 5% whiplash wasn’t random. It was the result of weak volume, heavy supply at known cost levels, and tight liquidity. Those conditions haven’t changed yet.