Zcash just cracked through a technical level that previously sparked brutal selloffs. Twice in the past month, breaking this line led to double-digit drops.
Now it’s happening again. And this time, traders are positioning for more pain ahead.
The 50-Day Line That Keeps Breaking Bad
Zcash fell below its 50-day exponential moving average. That might sound like boring chart stuff. But this specific line has predicted sharp drops with scary accuracy.
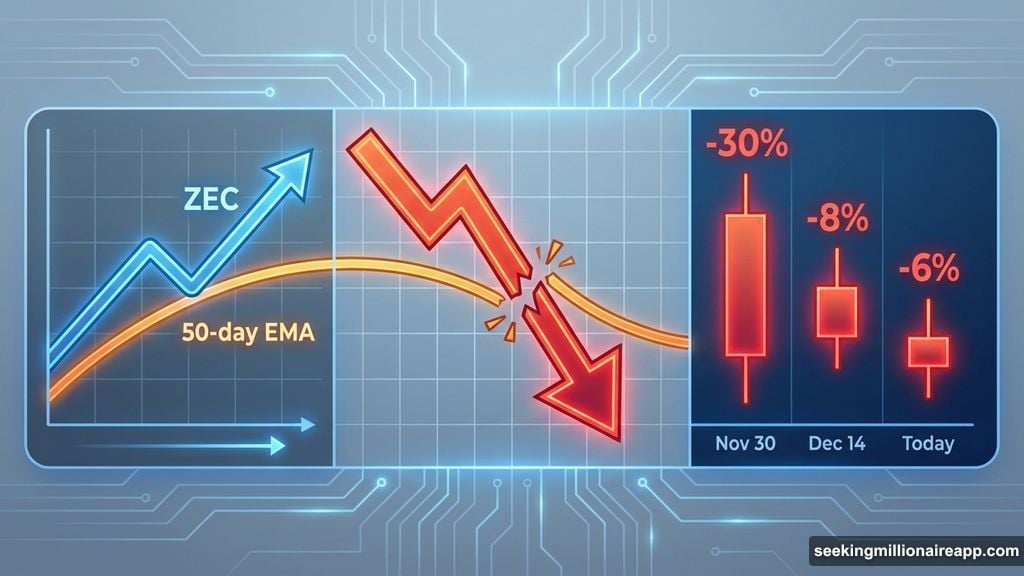
Back on November 30, ZEC closed below the 50-day EMA. Then the price tanked nearly 30% within days. Two weeks later on December 14, the same break happened again. That time, Zcash dropped about 8% over the following sessions.
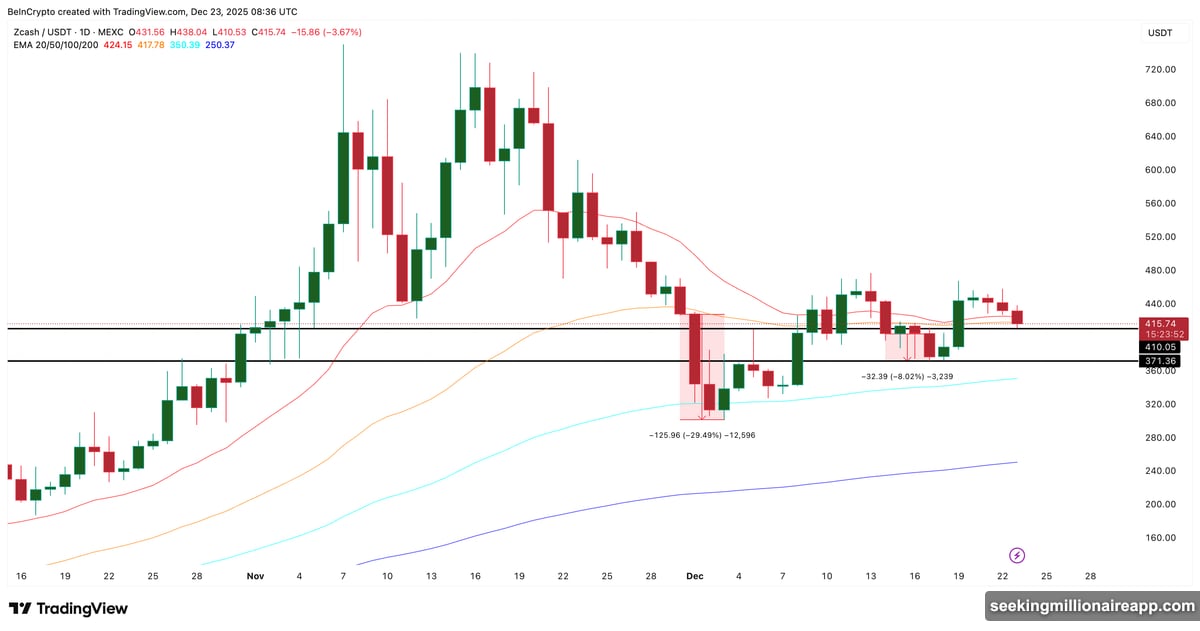
Now the pattern’s repeating. ZEC currently trades beneath this level after falling more than 6% in 24 hours. If today’s candle closes below the EMA, history suggests the bleeding continues.
The 50-day EMA acts like dynamic support during healthy trends. It smooths price action and often catches dips before they accelerate. When prices decisively break below it, the trend shifts from stable to actively bearish.
This isn’t just technical mumbo jumbo. The market repeatedly respects this line. Three times in recent months, breaking it triggered significant selloffs. The current break looks set to make it four.
Traders Are Betting Against Recovery
The derivatives market tells a clear story. Most major trader cohorts flipped net short over the past 24 hours.
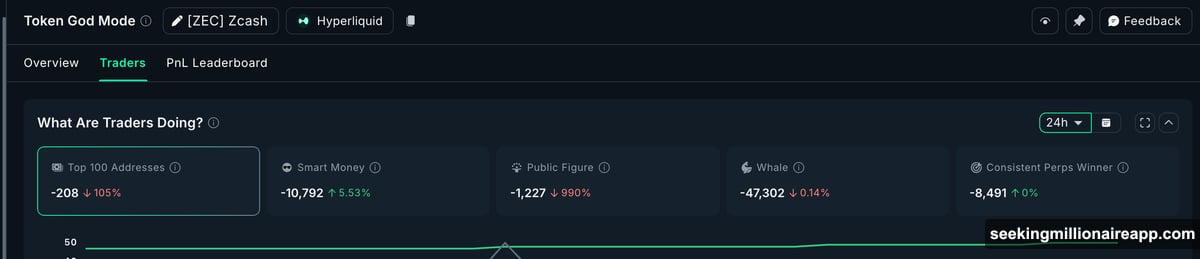
Top traders increased short positions. Whales did the same. Even public figures likely holding influence boosted bearish bets. Smart money pulled back shorts slightly, but not enough to change the overall picture.
When positioning shifts this uniformly, it signals conviction. Traders aren’t treating this as a temporary dip to buy. They’re preparing for continued weakness.
Plus, spot exchange inflows jumped more than 47% in one day on Solana-based ZEC markets. That kind of surge usually means coins moving toward exchanges. And coins on exchanges typically get sold.
The combination matters. Derivatives positioning and spot flows both point the same direction. When technical breakdown aligns with behavioral data, the signal strengthens considerably.
The 10% Drop Zone Comes Into View
If this breakdown holds, the next support sits near $410. That level caught recent pullbacks. Losing it opens the door to accelerated selling.
Below $410, the major downside target lands around $371. From current levels, that represents roughly a 10% decline. The math aligns closely with previous EMA-triggered drops.
If selling pressure intensifies beyond that, the next stop sits near $295 based on earlier consolidation zones. That would represent a much deeper correction.
Recovery needs clear signals. Zcash would need to reclaim the 50-day EMA decisively, then push above $470 to invalidate the bearish setup. Only above that region does the structure stabilize enough to eye $549 next.
Until those levels get reclaimed, the path of least resistance points down. The technical setup, trader positioning, and spot flows all align toward continued weakness.
History Rhymes Until It Doesn’t
Three times in recent months, this exact setup triggered significant drops. The first sparked a 30% crash. The second caused an 8% decline. Now we’re watching the third setup develop in real time.
Markets don’t repeat perfectly. But they often rhyme. The pattern recognition here is too consistent to ignore.
Zcash lost its trend guide. Traders positioned defensively. Supply moved toward exchanges. If the daily candle confirms the break, expecting another leg down isn’t speculation. It’s pattern recognition backed by positioning data.
The question isn’t whether the setup exists. The setup clearly exists. The question is whether this time proves different from the last two. Based on current data, betting on “different” looks riskier than betting on “repeat.”
Watch that daily close. If ZEC stays below the 50-day EMA, the 10% downside target becomes the base case scenario. Recovery demands reclaiming lost ground decisively. Until that happens, gravity pulls harder than hope.