
Long-term Bitcoin holders dumped 61% more coins in 24 hours. That’s a sharp acceleration, not gradual profit-taking.
Plus, spot ETFs just logged their weakest week since November. Meanwhile, a classic bearish chart pattern forms right at current price levels. And the buyers replacing stable holders? Mostly short-term speculators who flip at the first sign of trouble.
None of these signals would matter much alone. Together, they paint a picture of weakening conviction at a critical support zone.
A Bearish Pattern Forms as Momentum Rolls Over
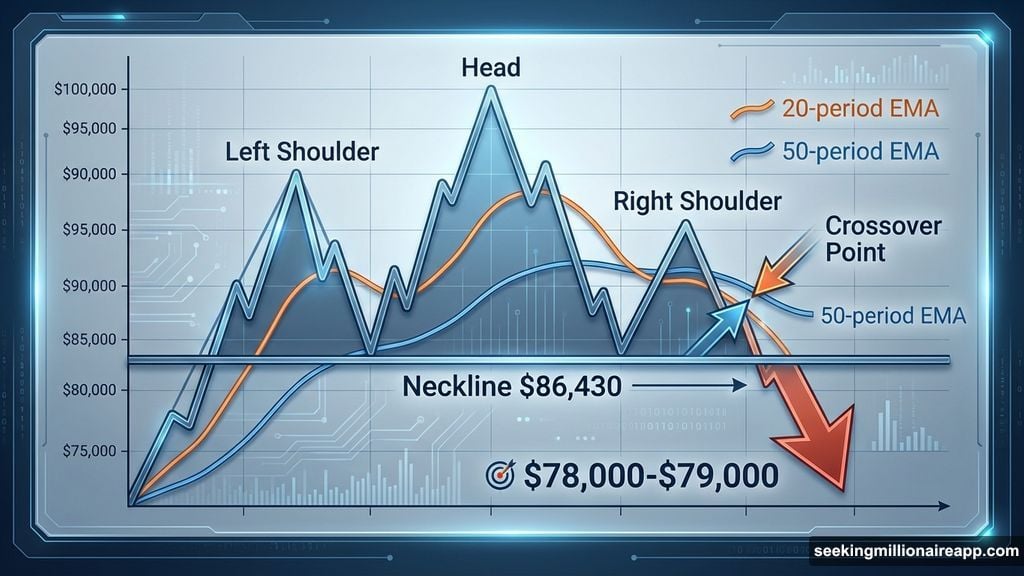
Bitcoin is building a head-and-shoulders formation on the 12-hour chart. This pattern shows up when rally attempts keep topping out lower. Each push loses steam faster than the last.
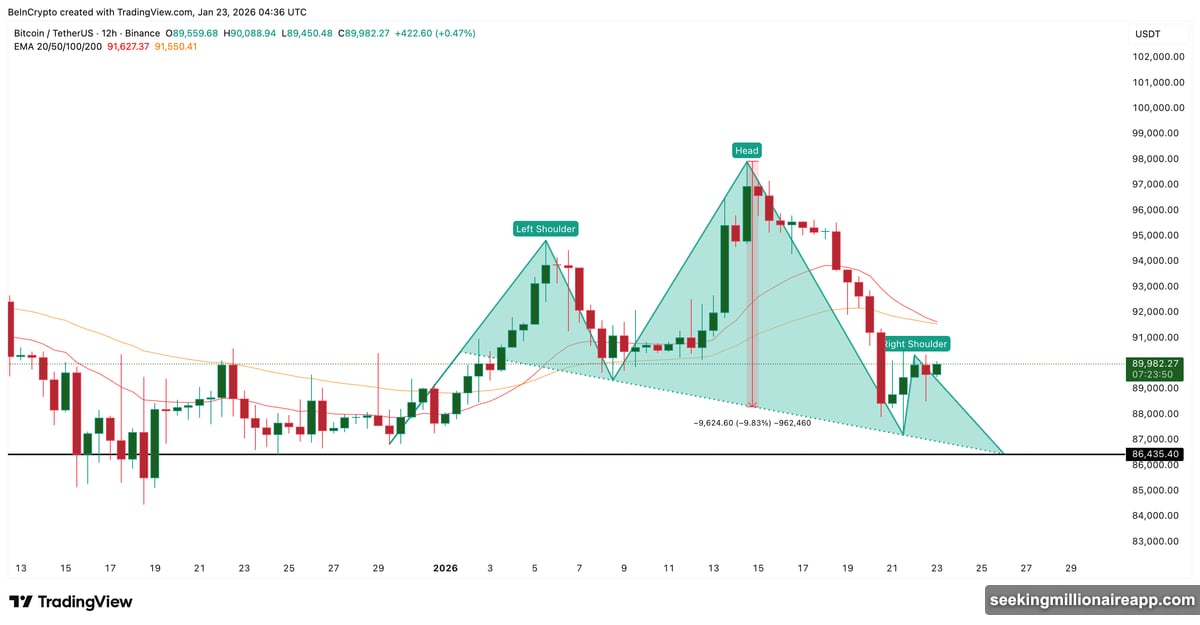
The neckline sits around $86,430. If BTC breaks below that level, the measured move suggests a potential 9-10% drop. That would put Bitcoin closer to $78,000-$79,000.
Technical indicators back this up. The 20-period exponential moving average is curling downward. It’s closing in fast on the 50-period EMA. When shorter averages cross below longer ones, sellers usually gain control. That crossover hasn’t happened yet. But it’s getting close.
This setup becomes more concerning once you see what long-term holders are doing.
Long-Term Holders Accelerate Selling
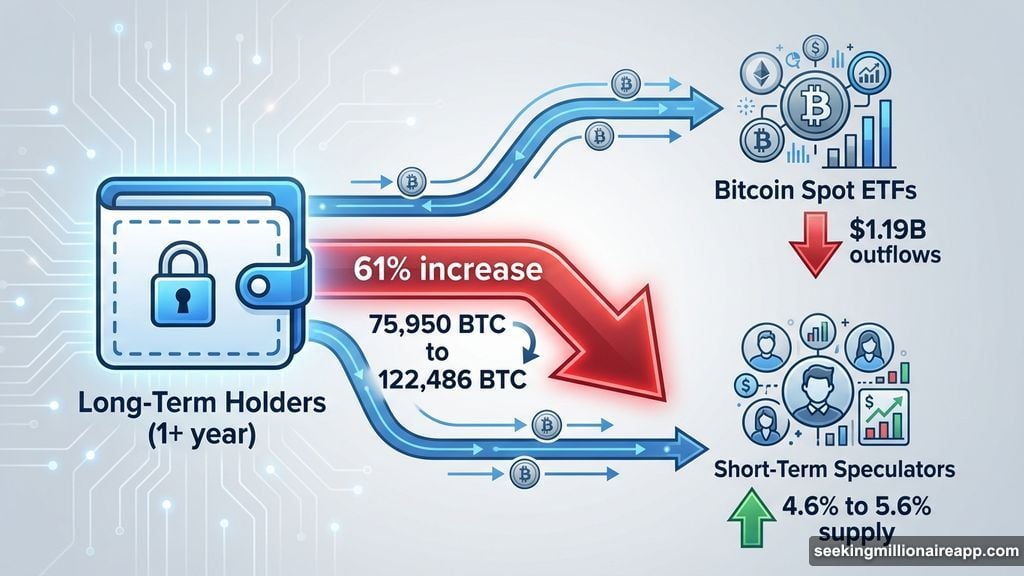
Wallets holding Bitcoin for over a year just ramped up selling pressure. On January 21, these holders sold roughly 75,950 BTC. By January 22, that figure jumped to about 122,486 BTC. That’s a 61% increase in one day.
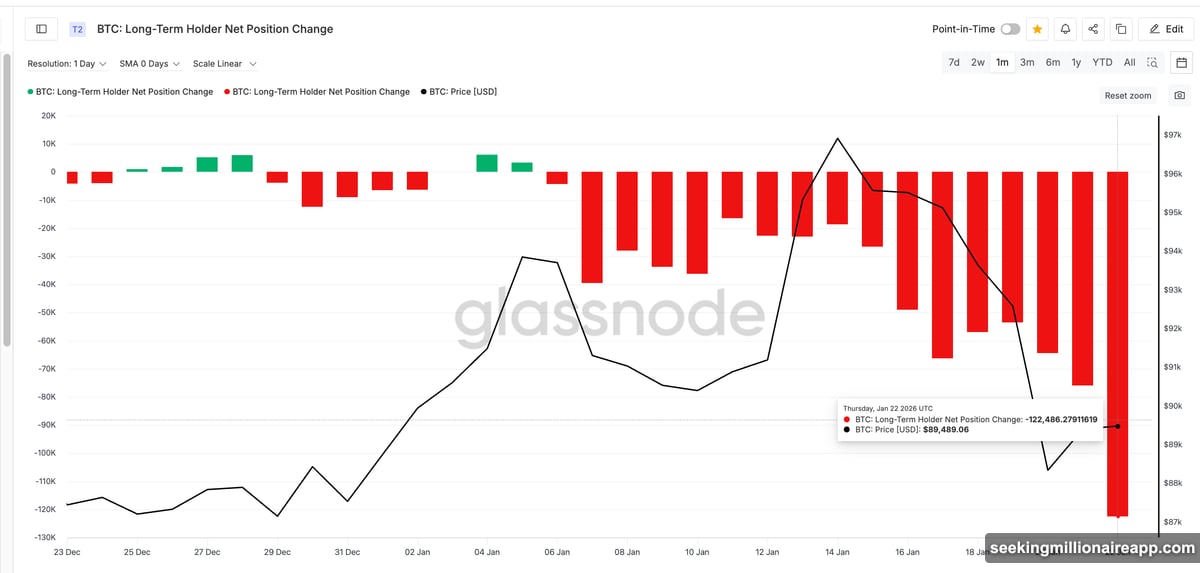
This isn’t panic selling. Long-term holder net unrealized profit/loss (NUPL) sits at a six-month low but remains in the “belief” zone. These holders still have profits. They’re choosing to reduce exposure, not getting forced out by losses.
So why sell now? Probably because they don’t see higher prices coming soon. When conviction weakens, smart money distributes into strength rather than waiting for weakness.
The question is: who’s buying what they’re selling?
ETF Demand Weakens While Speculators Step In
Bitcoin spot ETFs just recorded their worst week of 2026. For the week ending January 21, ETFs saw net outflows of about $1.19 billion. That’s also the weakest weekly performance since November.
This matters because ETFs provided steady, long-term demand. When long-term holders sold during previous pullbacks, ETFs absorbed that supply. Now that bid is gone.
At the same time, short-term speculators are stepping up. Holding data shows the one-week to one-month cohort increased from roughly 4.6% of supply on January 11 to about 5.6% now. That’s a 22% jump in just days.
These buyers typically chase dips and sell bounces. They don’t provide durable support. In fact, they often amplify volatility in both directions. So Bitcoin is seeing a handoff from stable buyers (ETFs and long-term holders) to flippers and traders. That shift usually caps upside and increases downside sensitivity.
Key Levels That Decide What Happens Next
All four risks now converge around a narrow price range. On the upside, Bitcoin needs a strong 12-hour close above $90,340 to reduce immediate pressure. That would push price back above the right shoulder of the head-and-shoulders pattern.
A move above $92,300 would be more meaningful. It would reclaim key moving averages and potentially flip momentum back to buyers. But that’s not happening yet. Instead, Bitcoin keeps grinding sideways while support weakens underneath.
On the downside, a break below $86,430 confirms the head-and-shoulders breakdown. Given the supply dynamics (long-term holders selling, ETFs withdrawing, speculators replacing them), that break could accelerate quickly. There’s less patient capital waiting to catch the falling knife.
The Real Risk Everyone’s Ignoring
Markets don’t crash from single catalysts. They break when multiple supports fail at once. Right now, Bitcoin is losing three layers of support simultaneously: technical structure, long-term holder conviction, and ETF demand.
That doesn’t guarantee a crash. But it does mean the safety net is thinner than most people realize. Short-term speculators can move price around. They just can’t hold it up when selling pressure intensifies.
The next week matters. Either Bitcoin reclaims momentum above $92,300, or it confirms the breakdown below $86,430. Given current dynamics, the path of least resistance tilts downward until something changes. Watch those levels closely.