Meme coins took a beating this week. Prices dropped hard across the board. But momentum indicators tell a different story now.
Three tokens—GIGA, SPX6900, and BONK—hit oversold levels that historically precede bounces. Plus, selling pressure appears to be slowing. So while the charts look ugly, the math suggests exhaustion might be setting in.
Let’s examine what the data actually shows.
Gigachad (GIGA): Testing Critical Support
GIGA crashed 31% over seven days. Now it trades around $0.00305. That’s brutal by any measure.
The decline shows classic distribution patterns. Sellers dominated. Buyers stayed away. Short candlestick wicks confirm weak dip-buying interest throughout the drop.
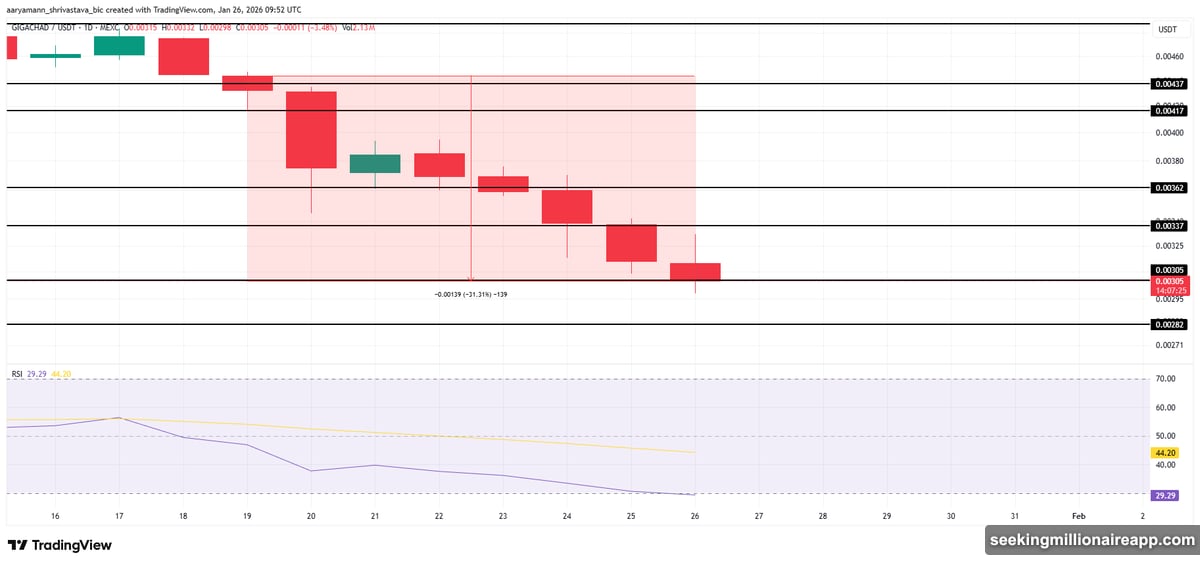
However, the Relative Strength Index just entered oversold territory. That means selling momentum is stretched. Not guaranteed to reverse. But stretched enough that a relief bounce becomes statistically probable.
Support sits at $0.00305 right now. If that level holds, GIGA could push toward $0.00337 first. Then $0.00362 becomes the next target. Nothing fancy. Just basic technical resistance levels that matter when momentum shifts.
The real test comes at $0.00362. Breaking above that resistance would flip market structure bullish. From there, GIGA could target $0.00417. That’s where the previous consolidation zone sits.
But flip the script. What if $0.00305 fails? Then GIGA slides to $0.00282. That move would invalidate the bounce thesis entirely. So the current support level defines the entire short-term outlook.
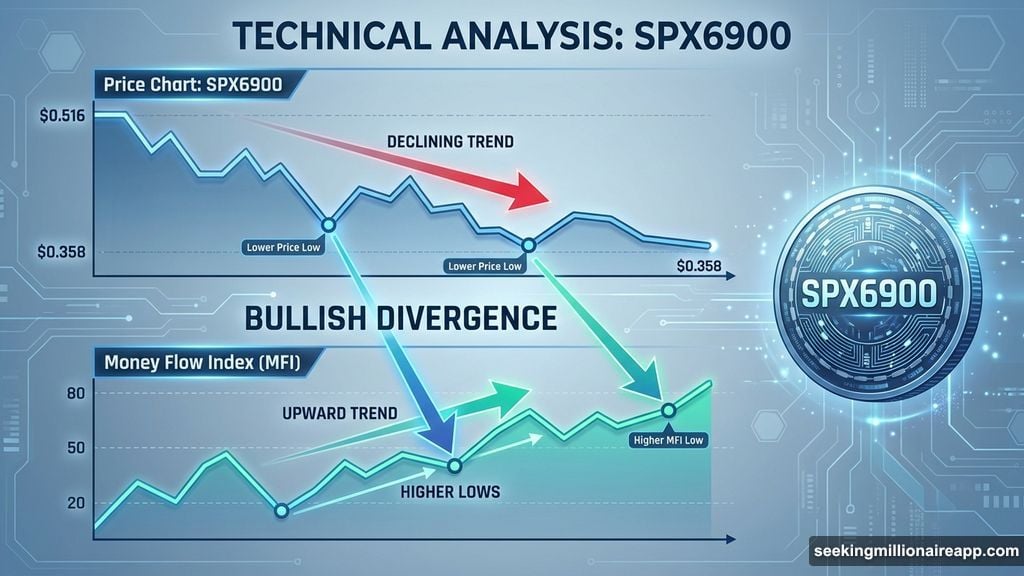
SPX6900 (SPX): Momentum Divergence Emerges
SPX dropped nearly 30% from its recent high near $0.516. The meme coin bottomed around $0.358. Multiple support levels broke during the decline.
That’s textbook bearish structure. Until you look at the Money Flow Index.
The MFI sits near oversold levels now. More importantly, while price made lower lows, the MFI formed higher lows. That’s bullish divergence. It suggests accumulation happened during the decline. Smart money potentially stepping in while retail capitulates.
The $0.358 to $0.401 zone represents key demand. If buyers defend this area, SPX could rally toward $0.427. That’s the first meaningful resistance. Beyond that, momentum could carry price toward previous highs.
But divergences fail sometimes. If SPX loses $0.358, the bullish thesis dies. Price would likely slide to $0.316. That’s the next major support zone. And at that point, the downtrend simply continues.
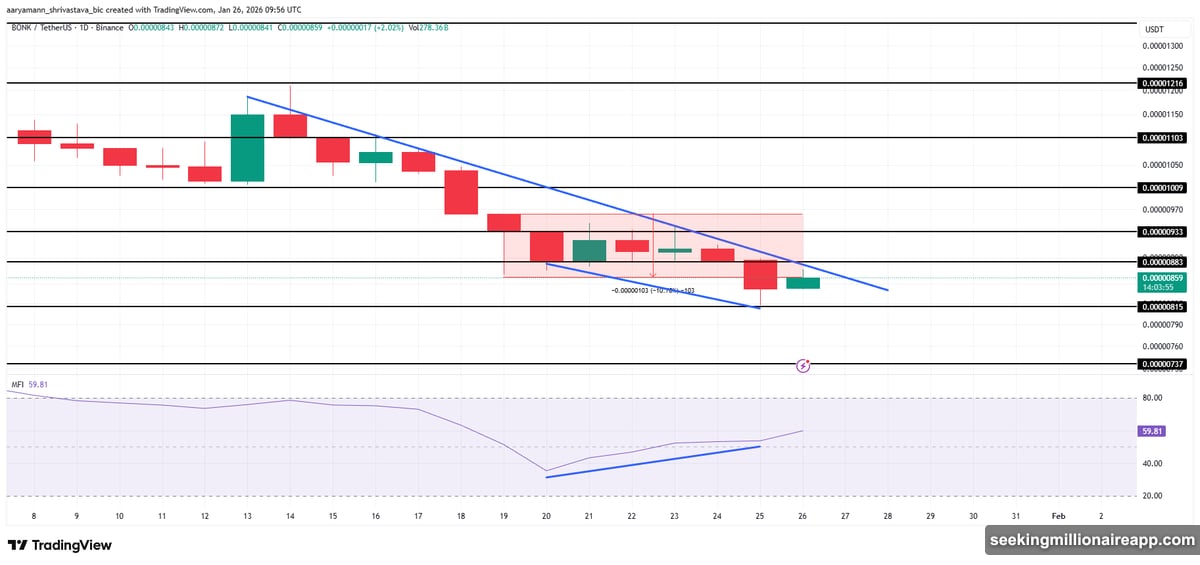
BONK: Relative Strength Stands Out
BONK only fell 10% this week. Compare that to peers dropping 30%. Relative strength matters in crypto. BONK is showing it.
Still, the token remains in a downtrend that started two weeks ago. Price trades near $0.00000859 currently. Sellers keep capping rallies. But the decline pace has slowed noticeably.
Here’s what’s interesting. While BONK made a lower low, the Money Flow Index printed a higher low. Another bullish divergence. This pattern suggests buying pressure is building beneath the surface.
If confirmed, BONK could break above $0.00000933 resistance. That move would end the downtrend. From there, $0.00001103 becomes the target. That’s where the previous consolidation zone sits.
The setup looks promising. But it’s still conditional. Failure to break resistance keeps sellers in control. And if BONK loses $0.00000815 support, the structure breaks down. Price would likely slide to $0.00000737. That invalidates the bullish case entirely.
What Actually Matters Here
These aren’t predictions. They’re probability assessments based on oversold indicators and emerging divergences.
Meme coins remain volatile. Sentiment shifts fast. But when multiple tokens show similar technical setups simultaneously, the sector-wide dynamics become relevant.
All three tokens hit oversold levels. All three show potential momentum divergences. And all three trade near support zones that matter historically.
Does that guarantee bounces? No. Markets don’t work that way. But it does suggest the risk-reward shifted. Downside looks more limited. Upside potential opened up.
Watch the key levels mentioned. They define whether these setups play out or fail. Simple as that.