
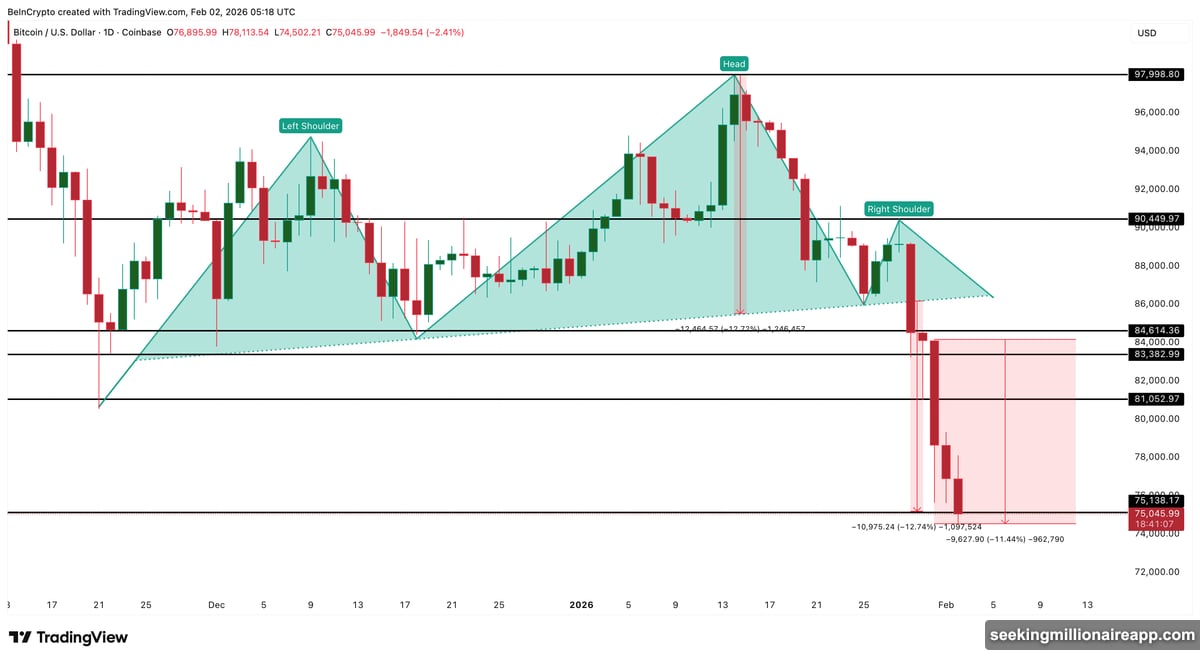
Bitcoin just hit its breakdown target near $75,000. Traders celebrated briefly. Then reality set in.
The price reached exactly where technical analysis predicted after breaking a head-and-shoulders pattern in late January. But hitting a target doesn’t mean the fall stops there. In fact, on-chain data suggests this might just be a rest stop on the way down.
Three critical metrics paint a concerning picture. Plus, the kind of buying needed to fuel a real bottom simply isn’t showing up yet.
Spot Buyers Vanished When Bitcoin Needed Them Most
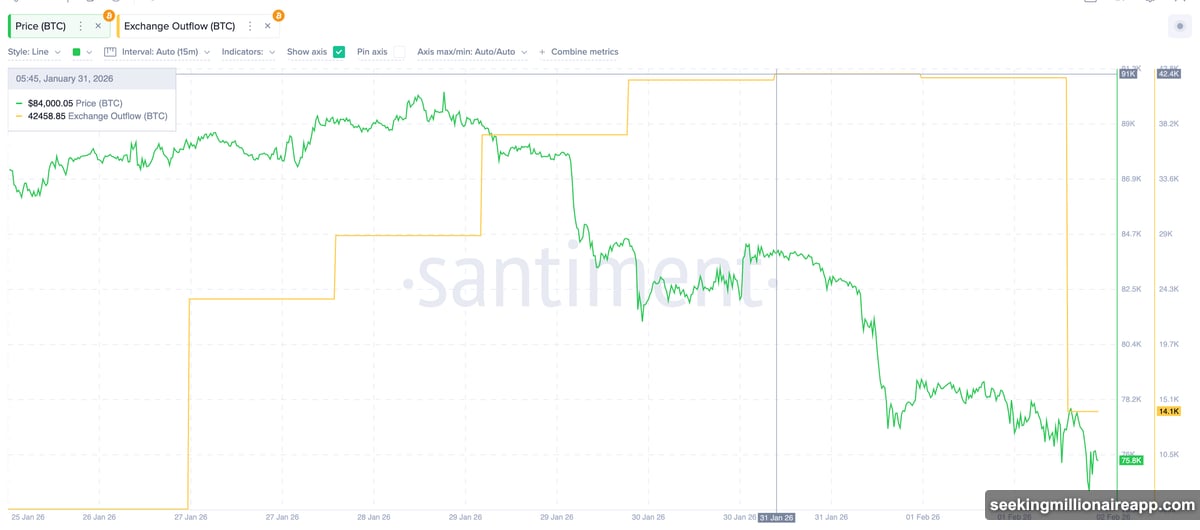
Exchange outflows tell you when people move Bitcoin off trading platforms into cold storage. That usually signals confidence and long-term holding. Right now? Those outflows collapsed.
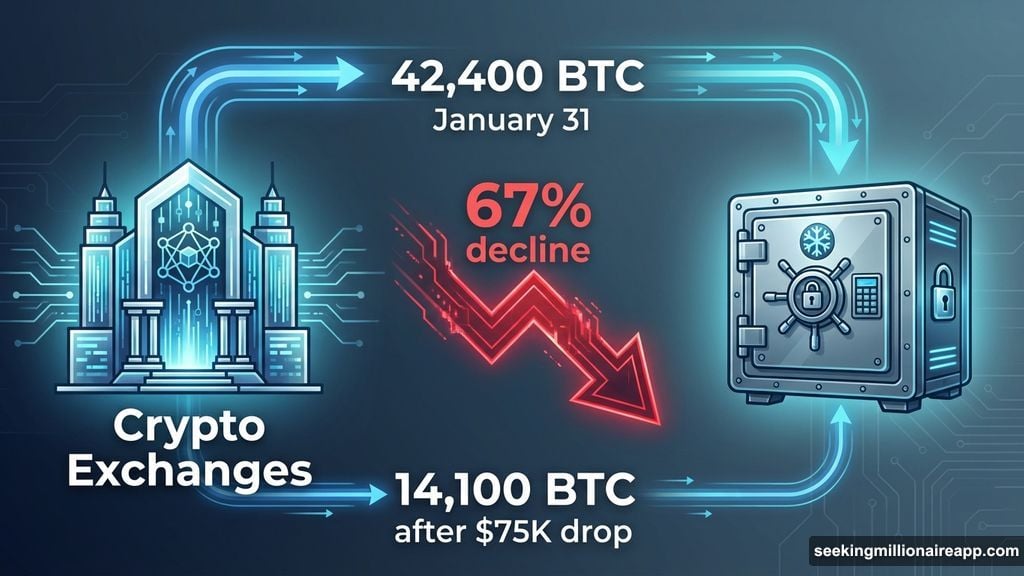
Around January 31, roughly 42,400 BTC left exchanges. After the selloff dropped prices to $75,000, outflows crashed to just 14,100 BTC. That’s a 67% decline in accumulation activity.
Translation: Nobody’s rushing to buy this dip. The bargain hunters stayed home.
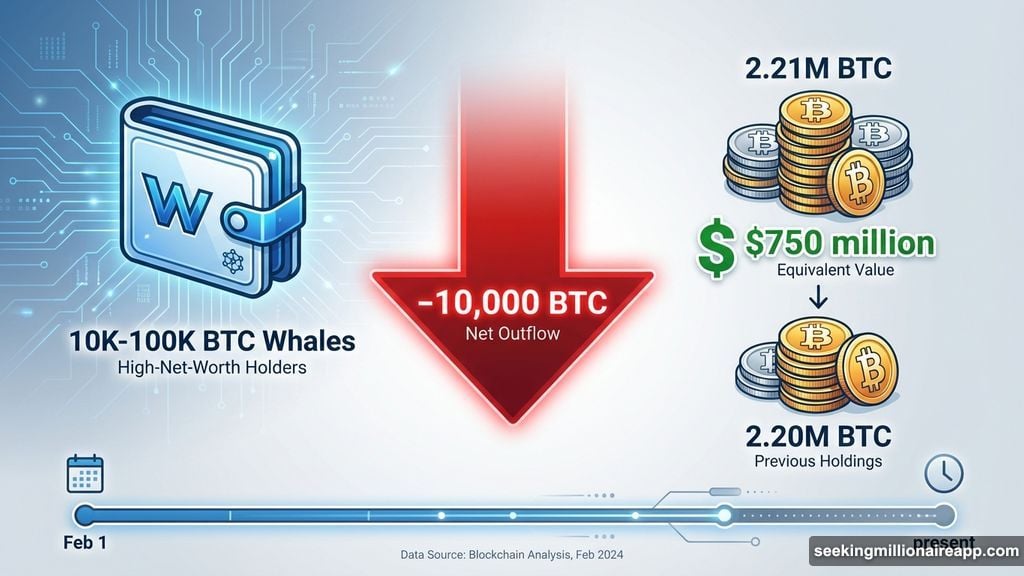
Meanwhile, whale wallets holding between 10,000 and 100,000 BTC started dumping. Since February 1, these large holders shed about 10,000 BTC worth roughly $750 million at current prices. Their combined holdings dropped from 2.21 million BTC to 2.20 million BTC.
So retail isn’t buying and whales are selling. That’s not exactly the recipe for a strong bottom.
Panic Started But Capitulation Hasn’t Finished
Short-term holder NUPL measures whether recent buyers are underwater or profitable. Right now it sits at -0.23, firmly in capitulation territory. That means newer buyers are panicking.
But here’s the catch. During November’s bottom, NUPL dropped to around -0.27 before Bitcoin finally rebounded. So panic exists, but not quite enough panic.
Think of it like a forest fire that burned half the underbrush but left fuel behind. The selling pressure damaged confidence, but more pain might be needed to shake out the last weak hands before a sustainable recovery begins.
This matters because strong bottoms form when capitulation reaches extremes. We’re close, but not there yet. That leaves room for another leg down.
Short Squeeze Could Spark Rally, Not Real Demand
Derivatives markets show a massive imbalance. Binance data reveals cumulative short positions near $1.91 billion, while long positions dropped to just $168 million.
When shorts pile up like this, even small price increases can trigger forced buying. Short sellers scramble to close positions, which pushes prices higher temporarily. That’s called a short squeeze.
However, squeezes create volatility, not stability. Once the forced buying ends, prices often drift back down unless real spot demand emerges. And as we already covered, spot demand is missing.
So yes, Bitcoin could spike upward and liquidate bears. But without genuine accumulation backing the move, any rally would likely fade. Then more long positions would open at higher prices, setting up the next wave of liquidations on the downside.
Derivatives offer fireworks. They don’t build foundations.
Two Key Support Zones Lie Below Current Prices
If $75,000 fails to hold, on-chain data points to clear downside targets.
UTXO Realized Price Distribution shows where existing Bitcoin supply was last purchased. These price clusters often act as support because holders defend their entry points.
The first major cluster sits at $66,890, where about 0.95% of total supply last changed hands. Below that, an even stronger zone appears at $63,111, holding roughly 1.14% of supply.
From a technical perspective, losing the $75,130 to $75,630 range opens the door to $69,500. Breaking that level exposes the $66,000 to $63,000 zone where on-chain support concentrates.
In a deeper selloff, support near $61,840 becomes relevant. So the next decision point happens at $69,500 if Bitcoin breaks current support.
On the flip side, recovery faces resistance at $79,890 and $84,140. Bitcoin would need to reclaim $84,140 decisively to restore bullish structure. Until then, gravity pulls harder than momentum.
Why This Bottom Feels Different From November
November’s correction ended with extreme capitulation, aggressive whale accumulation, and surging exchange outflows. All three confirmed strong hands were buying aggressively.
This time? Capitulation exists but hasn’t peaked. Whales are selling, not buying. Outflows dropped instead of spiking.
The technical pattern played out perfectly, bringing Bitcoin to its breakdown target. But patterns predict price moves, not market psychology. Right now, psychology looks fragile.
Could Bitcoin bounce from here? Absolutely. Short liquidations could spark a sharp rally. But rallies built on forced buying tend to be rentals, not purchases. Real bottoms need conviction, and conviction requires accumulation.
So far, the data shows hesitation, not commitment. That suggests more downside risk before a durable bottom forms. Maybe $75,000 holds. Maybe it doesn’t. But the metrics that confirmed November’s bottom are absent today.
Watch the $69,500 level closely if current support cracks. That’s where the next battle happens. And if that fails, the $63,000 to $66,000 zone becomes the must-hold line.
Bitcoin hit its technical target. Now it needs to prove this level means something more than just a number on a chart.