Bitcoin crashed over 22% last month. Now analysts are mapping where this bear market actually ends.
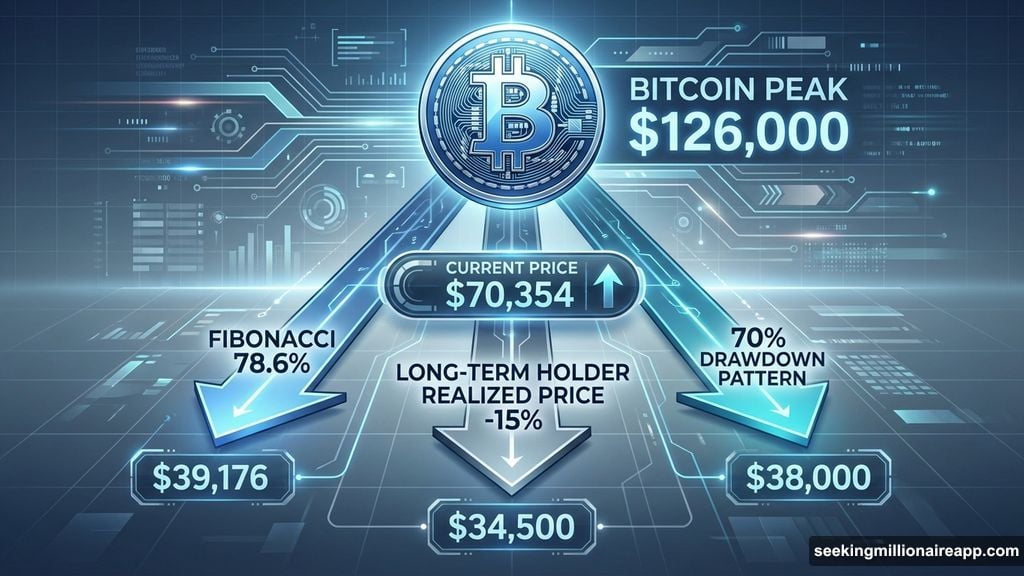
The biggest crypto briefly touched $60,000 last week before bouncing back. That was its lowest level in over a year. Now BTC trades around $70,354, up slightly on the day but still deep in correction territory.
So where does this drop finally stop? Analysts are watching several critical zones, mostly below $40,000. But others argue structural changes in the market make another deep crash increasingly unlikely.
The Fibonacci Floor at $39K
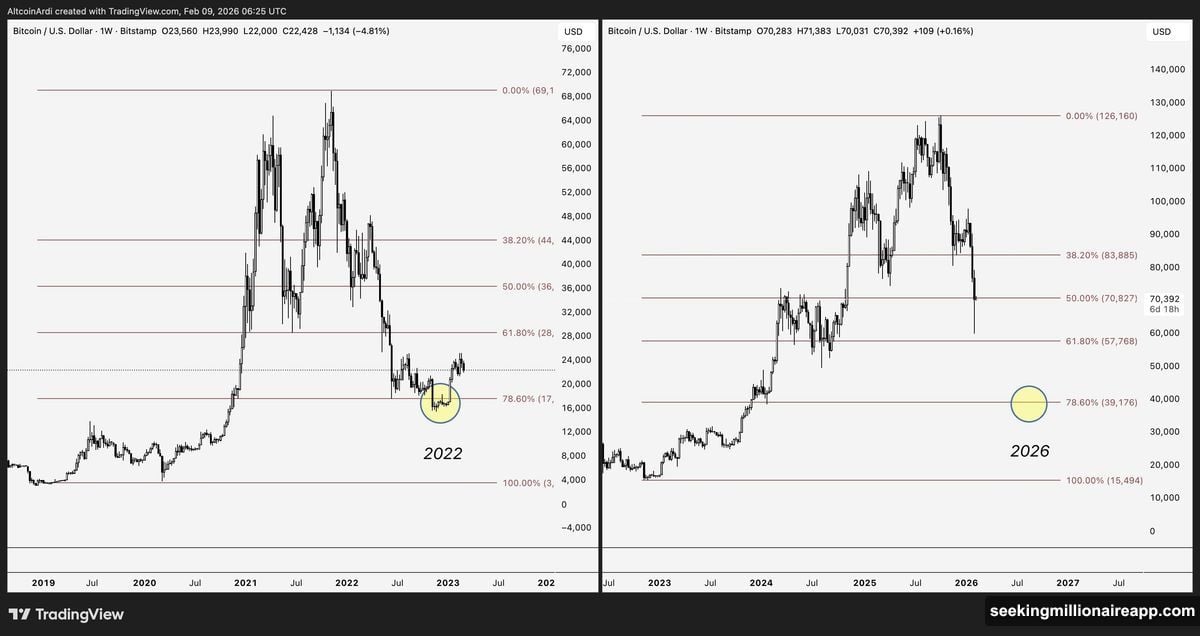
Technical analysis points to a familiar pattern. Analyst Ardi examined Fibonacci retracement levels from previous cycle bottoms. He found that Bitcoin hit the 78.6% Fibonacci mark during 2022’s bear market.
That same level now sits at $39,176. History doesn’t repeat exactly, but it often rhymes. If the pattern holds, BTC could fall another 45% from current levels.
However, market conditions today differ from 2022. Spot ETFs didn’t exist back then. Institutional adoption was minimal compared to now. Plus, regulatory clarity has improved significantly.
Historical Drawdowns Suggest $38K
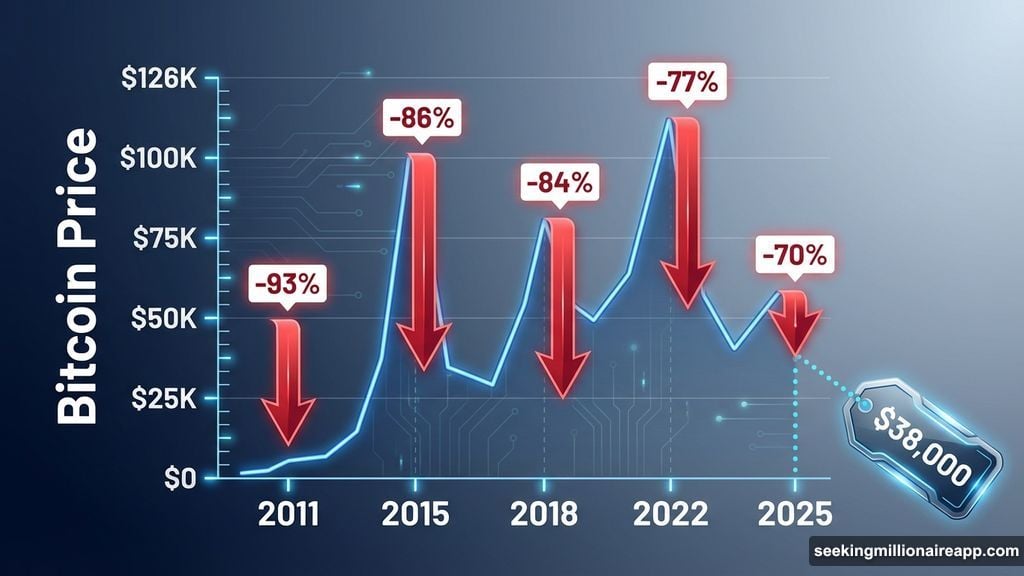
Past bear markets offer another clue. Analyst Nehal tracked Bitcoin’s maximum drawdowns across cycles. The numbers tell a clear story.
In 2011, BTC fell 93%. Then 86% in 2015. Down 84% in 2018. And 77% during the 2022 downturn. Each cycle’s decline was roughly 7% smaller than the previous one.
Following this pattern, if Bitcoin peaked near $126,000, a 70% drawdown would put the bottom around $38,000. That’s almost identical to the Fibonacci projection.
Yet this model assumes cycles continue to follow historical patterns. That’s not guaranteed, especially with ETF flows now influencing price action.
On-Chain Data Points Lower
Long-term holders provide another data point. Analyst Ted Pillows examined the long-term holder realized price, which tracks average cost for patient investors.
Cycle bottoms typically occur when prices drop 15% below this figure. With the current realized price at about $40,300, the model suggests a potential bottom near $34,500.
Pillows himself doubted that level would hit. But the data exists. Meanwhile, another analyst predicted Bitcoin fully bottoming at $30,000 by the end of 2026 before starting another multi-year rally.
That would represent a 57% decline from current levels. It would also shake out most retail traders who bought during the recent rally.
Why Some Think $50K Is the Floor
Not everyone sees massive declines ahead. Some analysts argue Bitcoin’s bottom already hit, or at least won’t go much lower.
A pseudonymous analyst noted that markets often bottom where investors least expect. Previous cycles saw bear market lows form just below prior all-time highs, not dramatically lower.
The key difference now? Market structure changed. Spot Bitcoin ETFs launched. Institutions deployed billions in capital. Infrastructure improved massively. These factors create support levels that didn’t exist before.
“Would institutions that just launched ETFs, onboarded billions in capital, educated shareholders, built infrastructure allow Bitcoin to revisit levels that invalidate their thesis?” the analyst asked.
Probably not. ETF issuers have reputational stakes. They educated boards and shareholders about Bitcoin’s long-term value. A crash to $30,000 would force uncomfortable conversations.
Plus, volatility still happens. Scary pullbacks remain possible. But structurally, sub-$50K Bitcoin requires something breaking, not just sentiment shifting.
The Sharpe Ratio Signal
Bitcoin’s Sharpe ratio recently dropped to -10, its lowest since March 2023. This metric measures risk-adjusted returns. Extreme negative readings historically appear near market turning points.
Analyst Darkfost revealed this data but cautioned against premature optimism. The reading suggests Bitcoin approaches a phase where risk-to-reward becomes extremely attractive. But that doesn’t mean the bear market ended.
This phase could last several more months. Further declines remain possible before any meaningful reversal takes hold. Markets can stay irrational longer than traders expect.
ETF Flows Tell a Story
Flow data reveals investor caution. Bitcoin ETFs continue seeing withdrawals. Stablecoin conversions are rising. These signals show limited appetite for aggressive dip-buying.
10x Research noted that positioning dynamics suggest traders remain focused on deleveraging rather than preparing for a typical snapback rally. That makes sense. After a 22% drop, many investors face losses and margin calls.
Until flows reverse, any bounces may prove temporary. Real bottoms typically form when sentiment reaches maximum pessimism and flows finally stabilize.
Bulls vs Bears: The Verdict
Two camps have emerged. Bears point to technical levels, historical patterns, and on-chain data suggesting $30K-$40K zones remain possible. Bulls argue institutional adoption and ETF infrastructure create structural support above $50K.
Both sides make valid points. Technical patterns suggest lower levels are possible. But market structure did change fundamentally in 2024-2025.
Bernstein analysts recently described this as Bitcoin’s “weakest bear market yet” with the observation that “nothing broke.” No major exchange collapses. No regulatory crackdowns. No protocol failures. Just a correction after a strong rally.
That distinction matters. Previous bear markets involved actual problems, not just price declines. This time feels different. Whether that translates to a higher bottom remains uncertain.
Markets will ultimately decide. For now, Bitcoin trades in a range while investors debate whether the worst has passed or if another leg down awaits. The answer probably arrives within the next few months.