
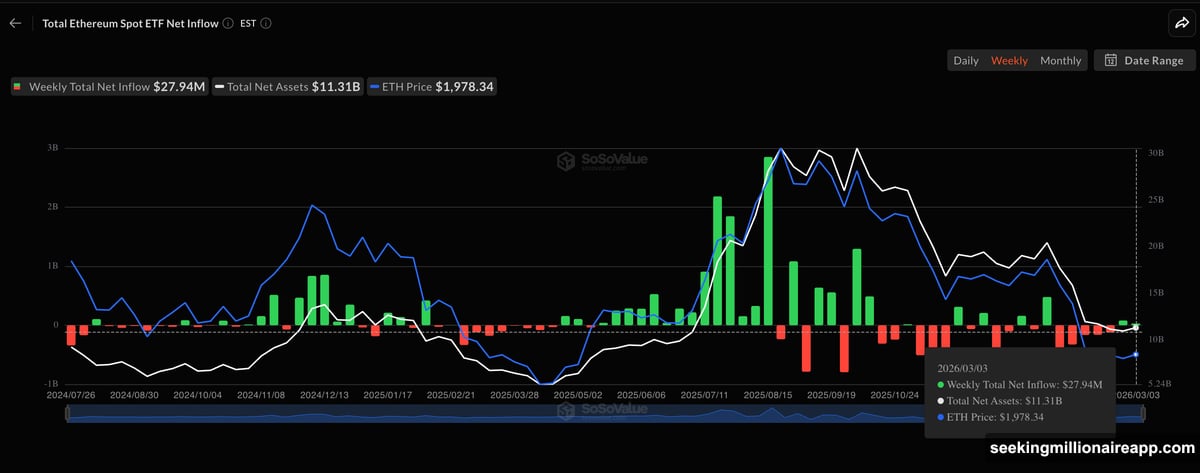
Ethereum is trading near $1,960, up 2.7% over the past week but slipping 1.8% in the last 24 hours. On the surface, that looks messy. But dig into the ETF flow data and something interesting starts to take shape.
For two consecutive weeks, Ethereum spot ETF inflows have turned positive. That follows a long stretch of outflows. And the last two times this exact flip happened, ETH bounced hard. We’re talking 11.6% in one case, 7.1% in another — averaging roughly 10% each time.
Now a third potential flip is developing. Here’s what the data actually shows.
ETF Flows Turned Green. History Says Watch Closely.
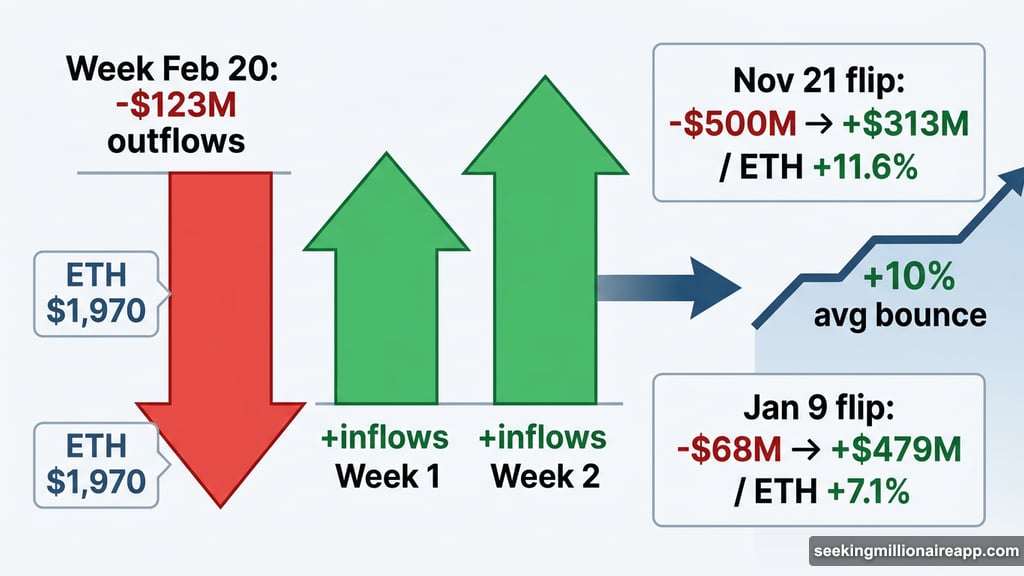
The last negative ETF week closed on February 20, with net outflows of $123 million and ETH sitting around $1,970. Since then, two straight green weeks have followed.
Compare that to previous flips. The week ending November 21 saw $500 million in outflows with ETH near $2,730. The very next week flipped to +$313 million in inflows — and ETH climbed to $3,050, a gain of 11.6%.
Then in early January, the week ending January 9 posted $68 million in outflows with ETH around $3,070. The following week turned positive at +$479 million in inflows. ETH rose to $3,290 — a 7.1% gain.
So the average bounce across both flips lands at about 10%. With two consecutive green weeks now confirmed following the February 20 red close, that same pattern appears to be setting up again.
RSI Divergence Adds Another Layer
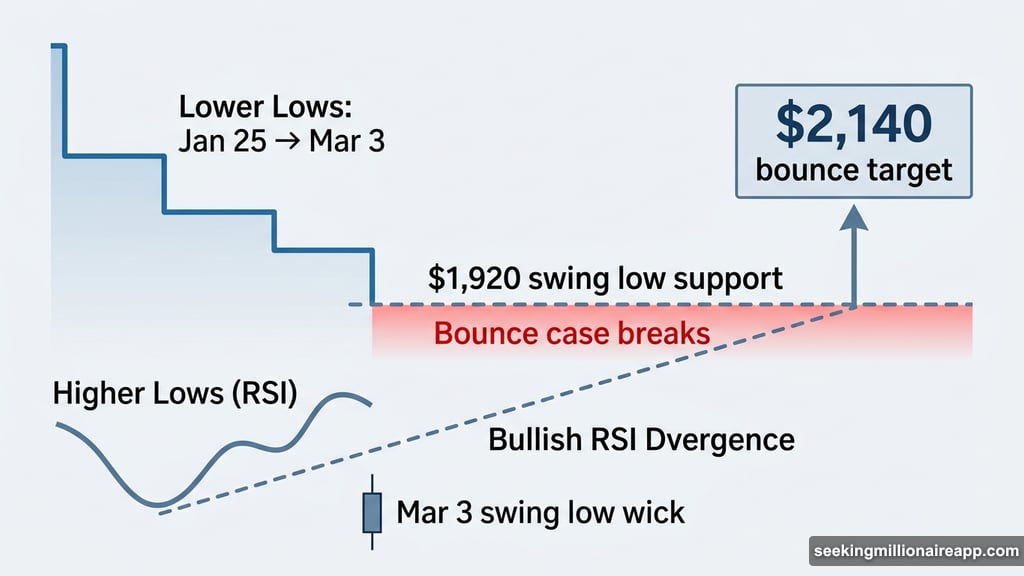
Beyond the ETF signal, the daily chart is showing a classic momentum setup. Between January 25 and March 3, Ethereum’s price has been making lower lows. But the RSI (relative strength index), which measures momentum, has been printing higher lows during that same stretch.
That gap between price direction and momentum direction is called a bullish RSI divergence. It often signals that selling pressure is exhausting itself. In the current climate, it might not mean a full trend reversal — but it does support the case for at least a meaningful bounce.
The March 3 candle also formed a swing low via its wick, keeping that short-term rebound alive. However, there’s a line in the sand. If the next candle breaks below $1,920, that swing low breaks and the immediate bounce case weakens. The broader divergence structure would still remain, but the short-term momentum setup loses its footing.
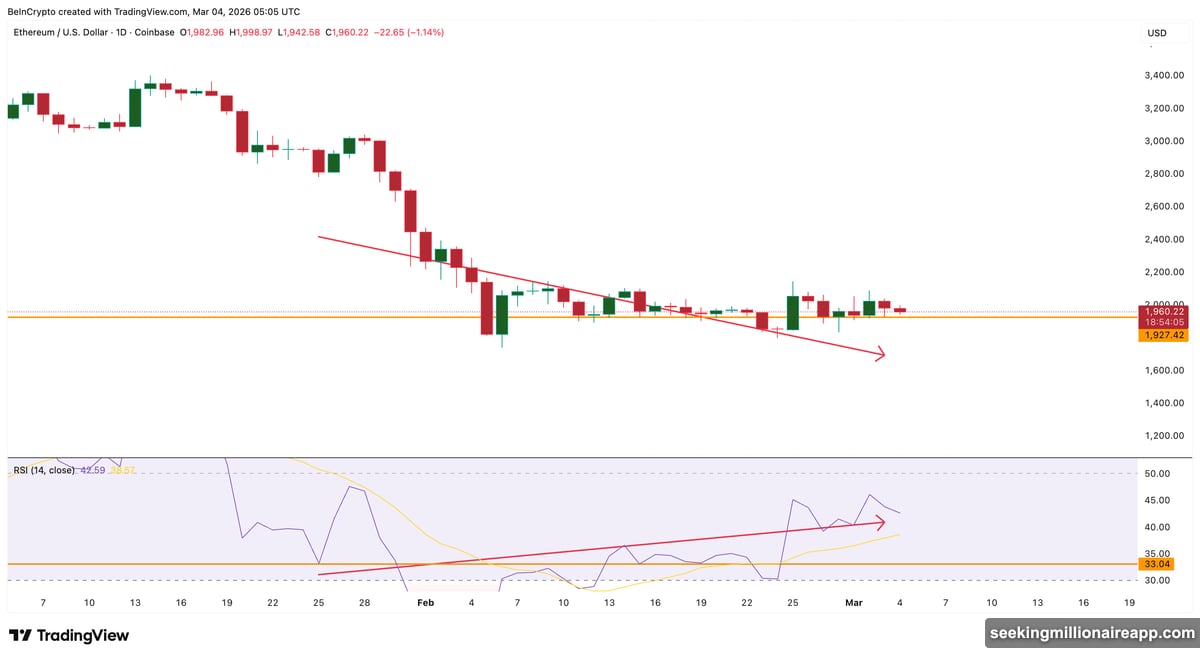
![Ethereum daily RSI divergence chart showing higher lows in momentum while price forms lower lows, pointing to a potential bounce toward $2,140]
URPD Clusters Show Where the Real Tests Are
To understand where selling pressure could pile up during a recovery, Glassnode’s URPD (UTXO Realized Price Distribution) data maps out which price levels hold the heaviest concentrations of ETH supply. Put simply, it shows where lots of holders bought in — and where they might want to sell to break even on any bounce.
The first significant cluster sits near $2,020, holding about 1.47% of total ETH supply. Any recovery attempt that reaches this zone means a large group of holders who bought near breakeven will have a decision to make: sell and escape flat, or hold and signal conviction.
Above that, a denser zone forms between $2,120 and $2,170. The $2,120 level holds 0.72% of supply. The $2,170 level holds 0.76%. Combined, that’s about 1.5% of all ETH sitting in a tight resistance band — one of the heaviest clusters near the current price.
But here’s the interesting part. If ETH manages daily closes above these clusters without getting rejected, it would mean those holders chose to hold rather than sell. And that conviction could be reinforced by the same positive ETF inflows that are now building — giving holders a reason to stay patient instead of bailing at breakeven.
$2,140 Is Where Three Signals Converge
Using Fibonacci levels drawn from the February 5 swing, the recovery path maps out cleanly. And it lines up almost directly with the URPD data.
The first test sits at $2,040. On the Fibonacci chart, that’s the 0.236 level. On the URPD, the $2,020 supply cluster sits just adjacent. A daily close above $2,040 would suggest the supply cluster was absorbed rather than sold into — a positive sign.
Clear that level and the next target is $2,140. That sits right inside the $2,120–$2,170 resistance zone where a combined 1.5% of ETH supply is concentrated. And critically, a move from the February 20 flip level of $1,970 to $2,140 works out to almost exactly 10% — matching the historical average gain that followed the previous two ETF flow reversals.
![Ethereum price chart with Fibonacci levels overlaid, showing $2,040 and $2,140 as key resistance targets with URPD supply clusters aligned]
That triple alignment of Fibonacci, URPD cluster, and ETF historical precedent makes $2,140 the level where this whole setup either proves itself or stalls out.
The Downside Risk Is Real Too
It would be misleading to talk only about the bullish case. ETH’s broader trend is still bearish — down almost 13% month-on-month. So the pattern here is a potential bounce within a downtrend, not necessarily a full reversal.
On the downside, $1,930 (the 0.5 Fibonacci level) is the nearest support. Below that, $1,920 is the critical swing low. A break there weakens the RSI rebound case, though the larger divergence structure stays intact.
Further down, a drop under $1,810 (the 0.786 Fibonacci level) would invalidate the divergence entirely. That opens the door to $1,720, with $1,460 as the deeper Fibonacci extension below that.
The setup is genuinely interesting, and the signals pointing toward $2,140 are well-supported. But the trade-off between a meaningful bounce and a continuation of the broader downtrend is still very much alive. Watch $1,920 on the downside and $2,040 on the upside — those two levels will do most of the talking in the days ahead.