
Bitcoin just did exactly what the warning signs predicted. When the price was hovering near $73,000, weakening momentum pointed to a drop. Sure enough, Bitcoin tumbled sharply and now trades around $68,000.
But here’s where things get interesting. The market structure forming right now tells a more complex story than a simple bearish slide. Several signals point toward a possible short-term bounce, even as a larger bearish setup quietly builds in the background.
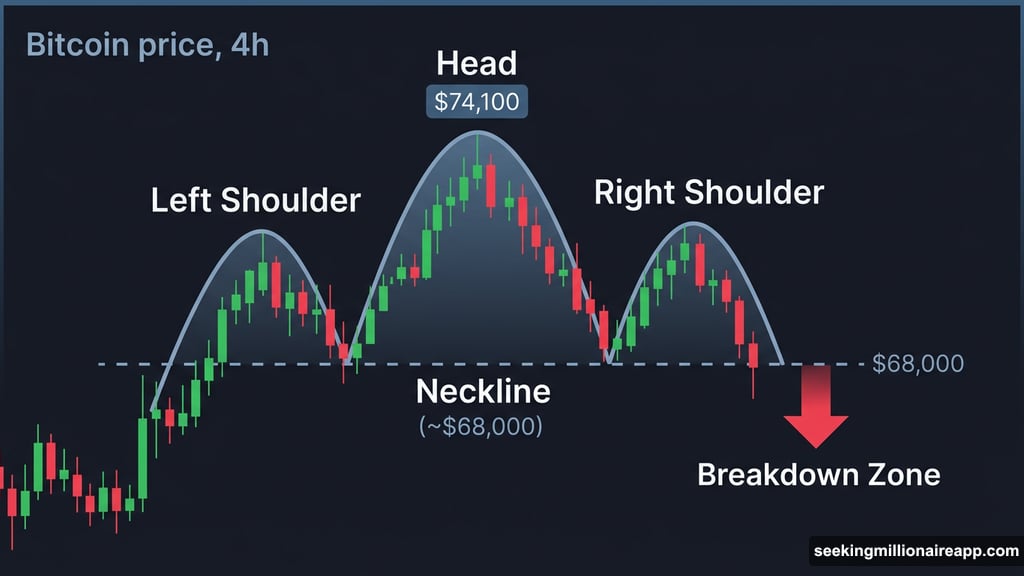
Head-and-Shoulders Pattern Takes Shape
On the 4-hour chart, Bitcoin is carving out a classic head-and-shoulders pattern. For anyone unfamiliar, this is a technical formation that often signals a trend reversal when a key level — called the neckline — gives way.
The pattern started forming after Bitcoin pushed toward $74,100 earlier this week. That level now marks the “head” of the formation. Since then, the price has gradually softened, and the right shoulder is currently developing.
So the shape is there. The question is whether it completes and confirms.
Did Whales Actually Buy the Top?
Here’s the uncomfortable part. Data tracking large Bitcoin wallets — those holding between 10,000 and 100,000 BTC — shows reserves climbing to roughly 2.24 million BTC on March 4. That timing lines up almost exactly with the formation of the pattern’s head near $74,100.
In other words, major holders appear to have increased their exposure right near the peak. And then Bitcoin dropped to $68,000.
That puts those whales in a tricky spot. But several market signals suggest they may still have a path to minimize losses through a layered short-term bounce before any bigger move plays out.
Short Liquidations Could Push Prices Higher
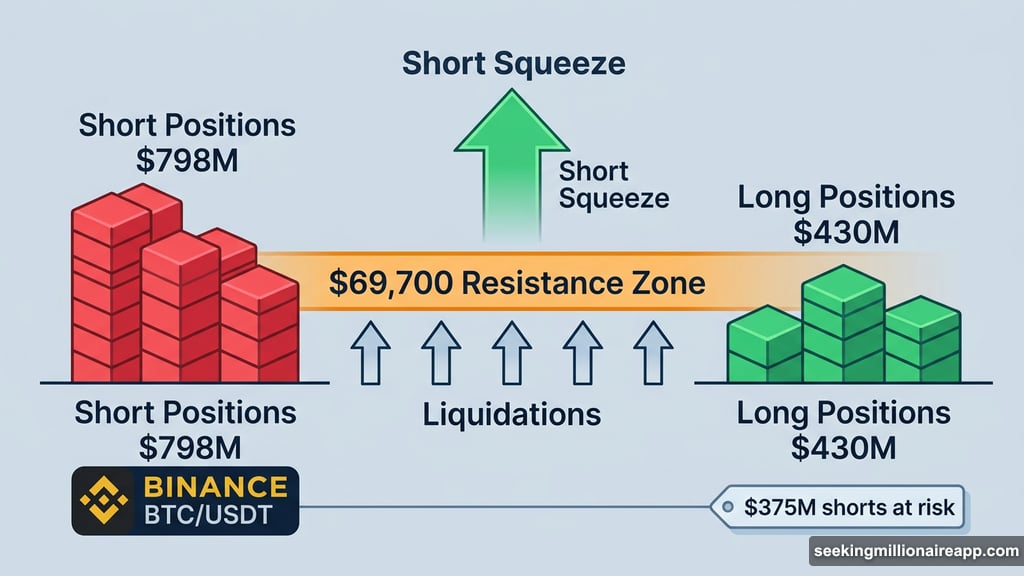
The derivatives market right now is heavily skewed toward short positions. On the Binance BTC/USDT perpetual pair, about $798 million in short leverage sits in the market compared to roughly $430 million on the long side. Shorts outnumber longs by more than 80%.
That imbalance matters a lot. If Bitcoin starts moving upward, those short positions begin getting liquidated. Traders scrambling to buy back Bitcoin push prices even higher, creating a self-reinforcing squeeze. It’s one of the most reliable short-term fireworks in crypto markets.
The biggest concentration of shorts clusters just above the $69,700 region. Nearly $375 million worth of short positions could get wiped out there. And that level also lines up with a key technical resistance zone on the chart, making it doubly significant as a short-term target.
Long-Term Holders Just Flipped to Buying
Another signal adds weight to the bounce case. Bitcoin’s long-term holder net position change — which tracks investors holding BTC for over a year — flipped positive on March 6 after nearly two months of steady selling.
According to Glassnode data, this metric had stayed negative since early January. The last comparable one-day flip happened on December 7, right before Bitcoin rallied from about $90,400 to $92,700. That was a move of roughly 2.5%.
Apply a similar 2.5% bounce to current prices around $68,000. The math lands almost exactly at $69,700. That’s the same level as the short liquidation cluster and the technical resistance zone.
Three separate signals pointing to the same price target is not a coincidence worth ignoring.
The Key Levels That Decide Everything
For short-term bulls, the first hurdle is a four-hour candle close above $68,600. Clear that, and the path opens toward the $69,700 liquidation cluster and potentially $72,000 beyond that.
But here’s the catch. Even reaching $72,000 would still leave the head-and-shoulders pattern fully intact. Bitcoin would need to reclaim $74,100 to truly invalidate the bearish setup. That’s a much heavier lift from current levels.
On the downside, the neckline sits near $67,800. A four-hour close below that level would confirm the pattern and likely trigger a deeper slide. The measured move from a confirmed breakdown points first to $65,300, then potentially as low as $61,100.
Where Bitcoin Actually Stands
The setup right now is genuinely two-sided, which makes it more interesting than most straightforward bearish or bullish narratives. A short squeeze toward $69,700 looks plausible given the derivatives skew, the long-term holder flip, and the liquidation cluster alignment. Whales caught near the top may be counting on exactly this kind of temporary relief.
But relief is not recovery. The broader technical picture stays bearish unless Bitcoin reclaims its previous highs. And weekend liquidity conditions make moves sharper and less predictable in both directions.
Watch $68,600 as the first checkpoint. If Bitcoin can close above it convincingly, the squeeze scenario gets real momentum. If it can’t, and $67,800 breaks, the head-and-shoulders pattern confirms — and the conversation shifts from bounce to breakdown.