Prediction markets have become something genuinely fascinating. They’re not just opinion polls. They’re money-backed signals where traders put real capital behind their convictions.
And right now, that capital is screaming bearish.
From Bitcoin to Ethereum to the Federal Reserve to NVIDIA, the crowd with skin in the game sees more downside ahead. But do the charts actually agree? Let’s dig in.
Prediction Market Volume Exploded While Prices Tanked
Something unusual happened since January 2026. Most retail investors stepped back as prices fell. But prediction market traders leaned in harder.
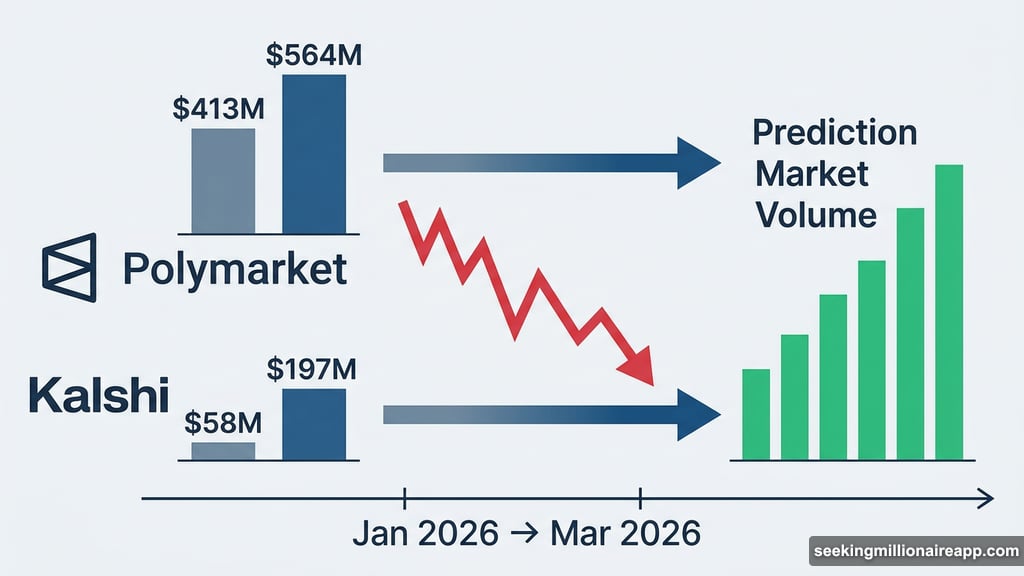
On Polymarket, weekly crypto notional volume climbed from $413 million in early January to $564 million by early March. That’s a meaningful jump. Meanwhile on Kalshi, crypto volume more than tripled over the same stretch — from roughly $58 million to $197 million.
Even Polymarket’s Economy category, covering macro bets like recession odds and Fed rate decisions, grew from $13 million to $20 million. Crypto still ranks as the highest non-sports category by notional volume on the entire platform.
Here’s what makes this signal worth paying attention to. This volume surge happened during a period of sharp price drawdowns. Traders aren’t sitting on their hands waiting for clarity. They’re actively pricing in more pain with real money on the line.
Bitcoin’s $55K Zone Is the Number to Watch
On Polymarket’s “What price will Bitcoin hit in 2026?” market — which has pulled in $22.5 million in total volume — the leading outcome is still above $75,000 at 87%. So bulls haven’t given up entirely.
But the momentum? That belongs to the bears.
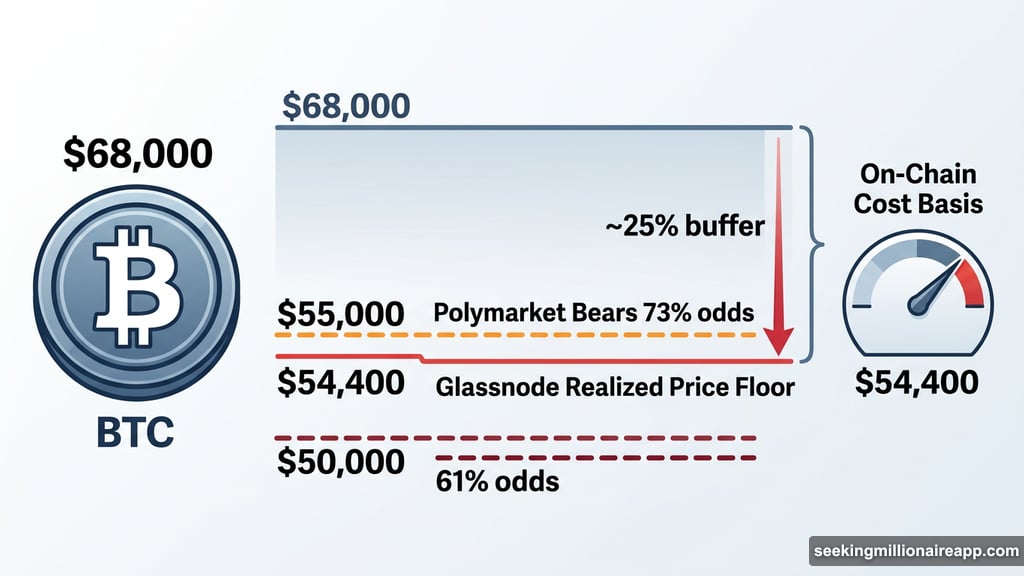
The fastest-growing outcome on the board is Bitcoin falling under $55,000, now sitting at 73% odds. That’s up 16 points in recent weeks. The under $50,000 outcome climbed too, now at 61% and gaining 9 points.
These aren’t random numbers. There’s a reason bettors keep clustering around the $54,000–$55,000 zone specifically.
On-chain data from Glassnode tells the story. Bitcoin’s realized price — the average cost basis of every coin on the network — currently sits around $54,400. This metric has historically served as the most reliable cycle floor. In every previous bear market, BTC has either tested or briefly dipped below this level before recovering.
Right now, BTC trades around $68,000. That puts it about 25% above its realized price. The buffer is real. But it’s narrowing.
If the conflict in Iran keeps oil prices elevated and forces the Federal Reserve to delay rate cuts, that $54,000–$55,000 zone becomes harder to ignore. The prediction market crowd is essentially pricing in a test of Bitcoin’s most structurally significant support. And the charts don’t disagree.
Ethereum’s Bear Flag Could Get Ugly Fast
Bitcoin’s setup looks concerning. But Ethereum’s situation is arguably more alarming.
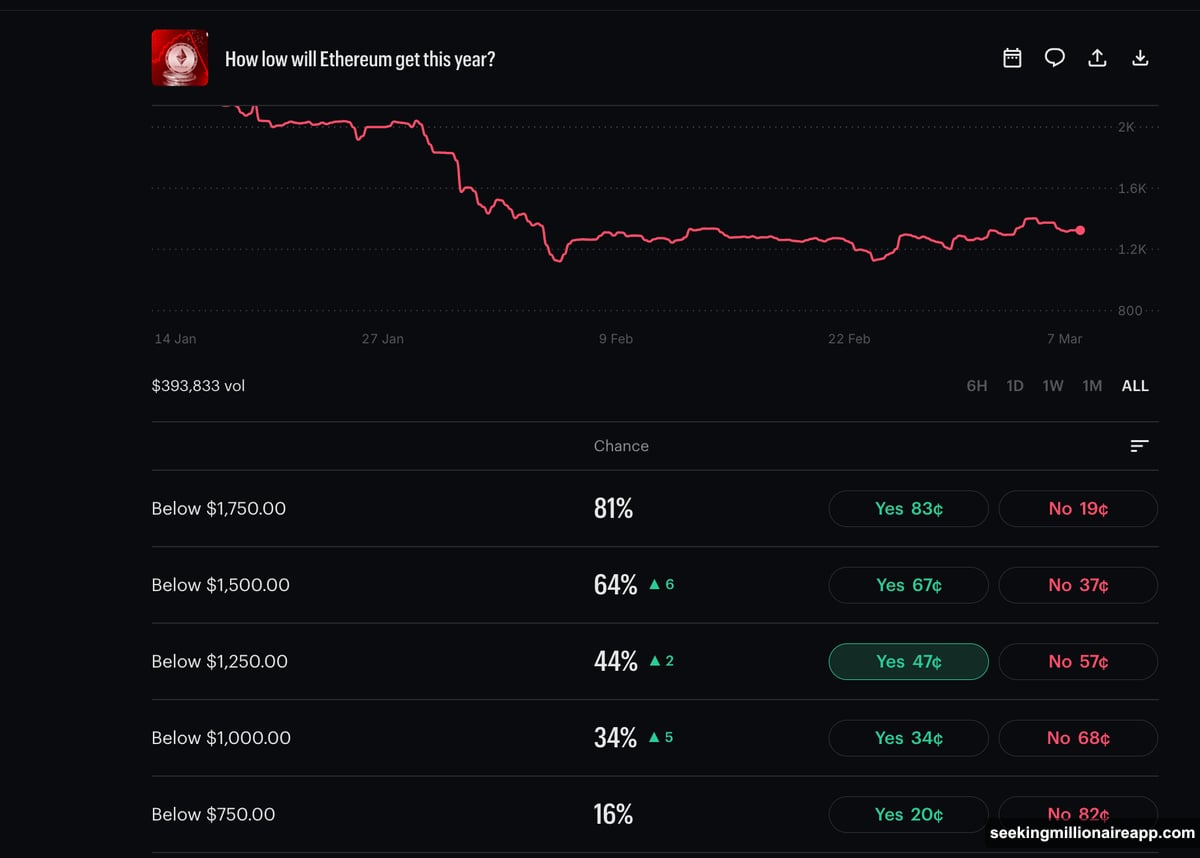
On Kalshi’s “How low will Ethereum get this year?” market, the numbers are stark. Below $1,750 sits at 81% odds. Below $1,500 is at 64% and climbing — up 6 points. Even the below $1,000 outcome has crept up to 34%, gaining 5 points.
Kalshi’s ETH forecast line has been in freefall since mid-January and currently projects around $1,330.
The weekly ETH/USD chart provides the technical backing for this conviction. Since early January, Ethereum has been forming a textbook bear flag — a continuation pattern that typically resolves to the downside. The critical line in the sand is the 0.236 Fibonacci retracement at $1,800.
A weekly close below that level would confirm the breakdown. The immediate target would land near $1,560, right at the 0.382 Fibonacci level. That lines up almost perfectly with the under $1,500 bet gaining traction on Kalshi.
It gets more precise from there. The 0.5 Fibonacci sits at $1,360 — also validating the under $1,500 territory. The 0.618 Fibonacci at $1,160 explains why the below $1,250 tier keeps quietly rising. And the full measured move of the bear flag projects as low as $920, which validates why the below $1,000 outcome is gaining momentum.
Each of these Fibonacci levels essentially maps to a specific Kalshi bet. The prediction market bettors and the technical chart are telling the same story.
One Fed Rate Cut, One Stagflation Trap
The bearish sentiment isn’t confined to crypto. Traditional finance markets are showing similar signals.
On Kalshi’s “Number of rate cuts in 2026?” market — with $1.89 million in volume — exactly one rate cut leads the board at 26%, and it’s the biggest gainer, up 10 points. Zero cuts sit at 17% and rising.
The Federal Reserve is caught in a genuinely difficult position. February’s jobs report showed the economy unexpectedly shed 92,000 jobs, pushing unemployment to 4.4%. Normally, that calls for rate cuts. But oil surged to $88–90 per barrel after the Iran conflict disrupted shipping through the Strait of Hormuz.
Rising energy prices push inflation expectations higher. That makes cutting rates risky. So the prediction market consensus — one cut, maybe — reflects a Fed that wants to ease but might only get one opportunity if oil cools enough.
That macro pressure flows directly into equities.
NVIDIA’s Head and Shoulders Pattern Worries Bulls
On Polymarket’s “What will NVIDIA hit in March 2026?” market, the leading outcome is under $164 at 50% odds. NVIDIA was trading around $177 as of Friday’s close.
The technical picture adds real weight to that bearish bet. Since early February, NVIDIA’s daily chart has been forming a head and shoulders pattern — one of the most reliable reversal signals in technical analysis. The neckline aligns closely with the 0.618 Fibonacci level at $169.
A daily close below that neckline would confirm the pattern breakdown. The downside targets would be $164 — the 0.786 Fibonacci level — and then $159. That explains precisely why the under $164 outcome leads on Polymarket at 50%.
The bull case does exist. If NVIDIA holds above the 0.382 Fibonacci at $175 and reclaims the $178–$184 range, the head and shoulders pattern gets invalidated. Bulls would retake control. But that’s the hurdle they need to clear first.
Each of these prediction market bets carries its own invalidation level. That’s actually what makes these markets valuable — they force traders to define exactly where they’re wrong, not just where they think prices are going.
Prediction markets have grown into a genuine force for gauging market sentiment. Right now, that sentiment is leaning bearish across Bitcoin, Ethereum, Fed policy, and equities simultaneously. The charts, the on-chain data, and the money-backed forecasts are all pointing in the same direction.
Whether the bulls can change that story depends on a few key levels. Watch Bitcoin near $68,000, Ethereum’s weekly close around $1,800, and NVIDIA’s behavior around $169–$175. Those levels will either confirm the bears were right — or prove the prediction market crowd wrong and hand contrarian traders a significant opportunity.