
Bitcoin investors are staring at two very different futures right now. One analyst is waving a red flag at $63,700. Meanwhile, the price chart is quietly sketching out an 18% rally toward $88,000.
So which comes first? The answer depends on a battle playing out right now between accumulating whales, cautious long-term sellers, and one very important support level.
The Cup-and-Handle Setup Pointing to $88,000
Let’s start with the optimistic case, because the chart structure is genuinely interesting.
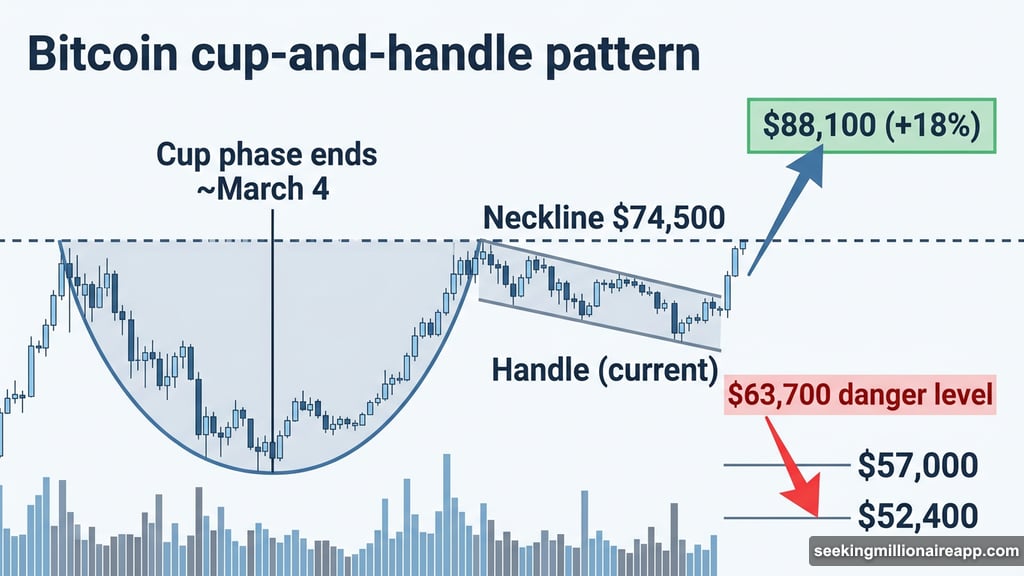
Since around February 8, Bitcoin has been forming what traders call a cup-and-handle pattern on the daily chart. Think of it like a coffee mug viewed from the side: a rounded bottom followed by a short sideways drift. The cup phase wrapped up near March 4, and Bitcoin is now grinding through the handle portion.
If Bitcoin breaks above the neckline near $74,500, the pattern projects an 18% move toward $88,100. That’s the bullish scenario. But right now, that target sits more than 10% above current prices. So there’s a meaningful gap between where Bitcoin is and where the pattern wants to take it.
Alphractal’s $63,700 Warning
Here’s where things get complicated. Joao Wedson, founder of on-chain analytics platform Alphractal, recently flagged $63,700 as a critical structural level that Bitcoin simply cannot afford to lose.
Wedson’s concern isn’t just technical. The level is grounded in on-chain data, meaning it reflects where actual investors hold meaningful positions. Lose that floor, and the market could tip into a broader redistribution phase, a scenario where sellers gain control and buyers step back.
The downside targets if support breaks? First stop is around $57,000. Further pressure could drag prices toward $52,400. Wedson notes these thresholds shift slightly day-to-day based on live blockchain activity, but the danger zone centers firmly around the $63,000 to $64,000 range.
That’s uncomfortably close to current prices. And it makes the bullish chart pattern feel a lot more fragile.
Bitcoin Whales Are Quietly Loading Up
Now for the on-chain picture, which leans more encouraging.
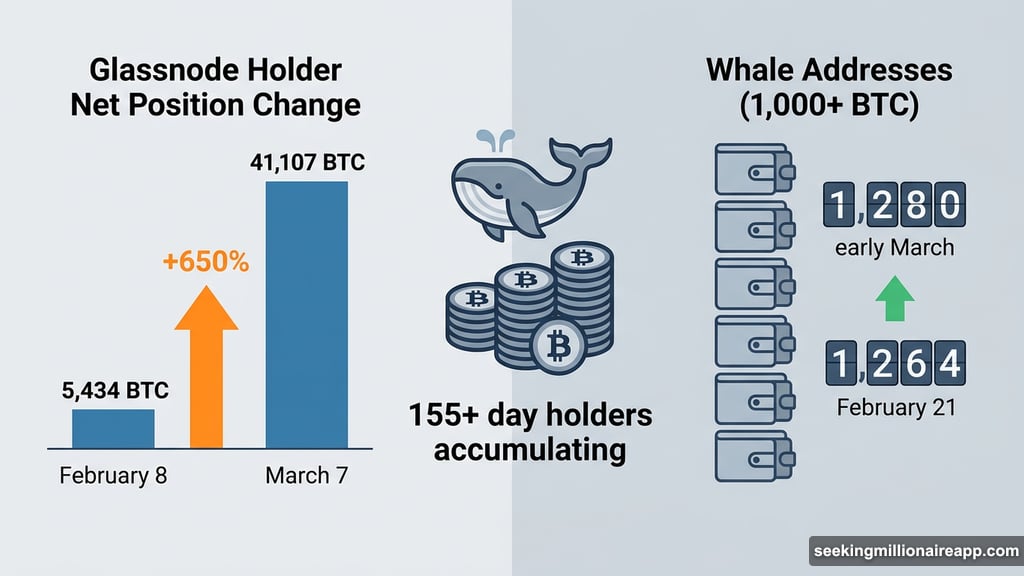
Data from Glassnode shows Bitcoin’s Holder Net Position Change metric has surged since mid-February. This metric tracks accumulation by wallets holding coins for 155 days or longer. When it rises, investors are choosing to hold rather than sell.
Between February 8 and March 7, the 30-day net position change jumped from roughly 5,434 BTC to more than 41,107 BTC. That’s a 650% increase over the same period the cup pattern was forming. In plain terms, mid-to-long-term holders were quietly stacking Bitcoin while prices consolidated.
Whale behavior tells a similar story. The number of Bitcoin entities holding at least 1,000 BTC climbed from 1,264 addresses on February 21 to around 1,280 by early March. That approaches the highest month-on-month levels seen recently. A small dip appeared between March 4 and March 5, but the overall upward trend held firm.
Both signals suggest larger, more patient investors are positioning for a move higher. That aligns neatly with the bullish chart setup.
Long-Term Holders Are Selling Into Strength
Here’s the complicating factor that doesn’t get enough attention.
While whales and mid-term holders accumulate, one specific group is quietly reducing exposure. Bitcoin HODL Waves data shows the cohort of investors holding coins for three to five years has been trimming positions. Their share of circulating supply dropped from roughly 11.49% on February 5 to about 10.94% by March 7.
The percentage change looks small on paper. But applied to Bitcoin’s fixed total supply, it represents a real and meaningful shift in coins re-entering circulation. These are older, patient investors who bought years ago and are now choosing to sell into current prices.
So you have two camps pulling in opposite directions. Whales and mid-term holders accumulate. Experienced long-term investors distribute. That divergence creates a subtle but persistent source of selling pressure, which makes holding $63,700 support even more critical.
Fibonacci Levels Confirm the Critical Zone
A broader technical analysis adds weight to Wedson’s warning. Mapping Fibonacci retracement levels across Bitcoin’s roughly 33% decline between January 28 and February 6 reveals a clear support zone around $63,300.
That aligns closely with the $63,700 threshold flagged by Alphractal’s on-chain model. The convergence of technical and on-chain analysis at the same price region is hard to ignore. Both frameworks point to the same floor.
If that floor breaks, Fibonacci levels suggest the next meaningful support appears near $56,700, matching Wedson’s $57,000 target almost exactly. Below that, $52,000 aligns with his $52,400 downside zone.
For the bulls to take control, Bitcoin needs to reclaim the neckline near $74,100 to $74,500. That move would confirm the cup-and-handle breakout and open the path toward $88,100. Until that happens, the market sits in an uncomfortable no-man’s-land.
What This Means for Bitcoin’s Next Move
Bitcoin is caught in a genuinely tricky spot. The chart structure is constructive, the whale accumulation data is encouraging, and the long-term setup looks promising. But the $63,700 support level sits just below current prices, and a break there could unwind the bullish thesis quickly.
The next few weeks likely come down to one question: can demand from accumulating whales and mid-term holders offset the selling pressure from older coin holders and keep that support intact?
If yes, the cup-and-handle breakout toward $88,000 stays alive. If no, the correction Wedson flagged could arrive before the rally does. Both outcomes remain firmly on the table, and that’s exactly what makes this such a pivotal moment for Bitcoin.