
Ethereum had a rough week. Since March 6, ETH dropped nearly 8%, and the culprit looks like a massive founder-level transfer that spooked the market. But here’s where things get interesting — some of the biggest whale cohorts on the network quietly stepped in and started buying. So what’s actually happening, and where does ETH go from here?
Let’s walk through it.
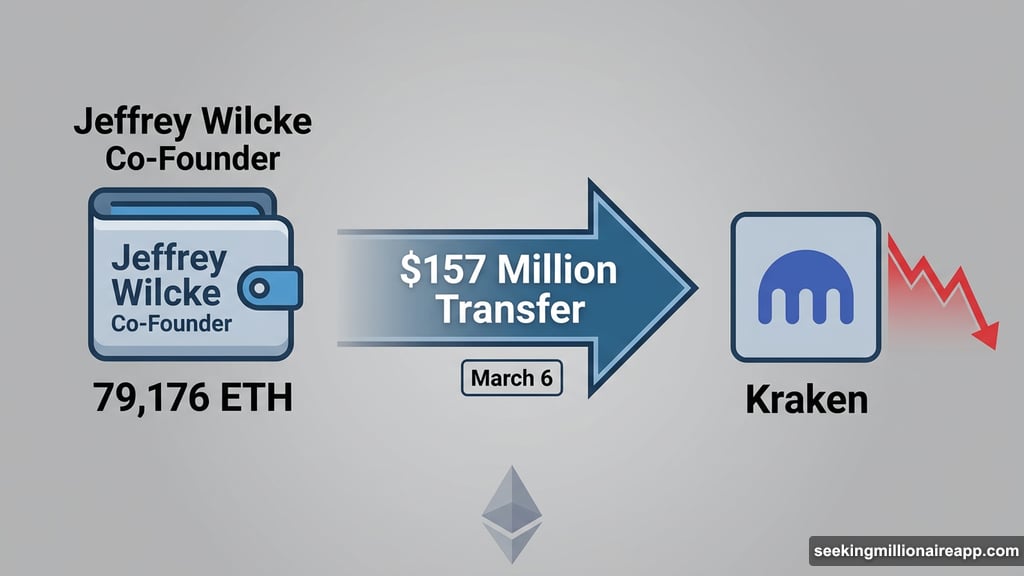
A $157 Million Transfer Shook ETH Sentiment
The turbulence started when Jeffrey Wilcke, one of Ethereum’s co-founders, moved 79,176 ETH — worth roughly $157 million — to the Kraken exchange. Transfers of this size to exchanges typically signal that a sell is coming, and markets reacted accordingly.
On-chain data tracking whale supply outside exchanges also dropped by about 80,000 ETH around the same time. At first glance, that looked like broad whale distribution. But the numbers tell a more specific story.
That 80,000 ETH decline closely matches Wilcke’s own transfer. Blockchain analytics platform Santiment noted the timing and size aren’t coincidental — the co-founder’s deposit likely shows up inside the aggregate whale metric, making one large wallet move look like widespread selling.
So the panic may have been somewhat misplaced.
Whale Cohorts Are Actually Stacking ETH
When you break whale behavior down by cohort rather than aggregate totals, the picture flips completely.
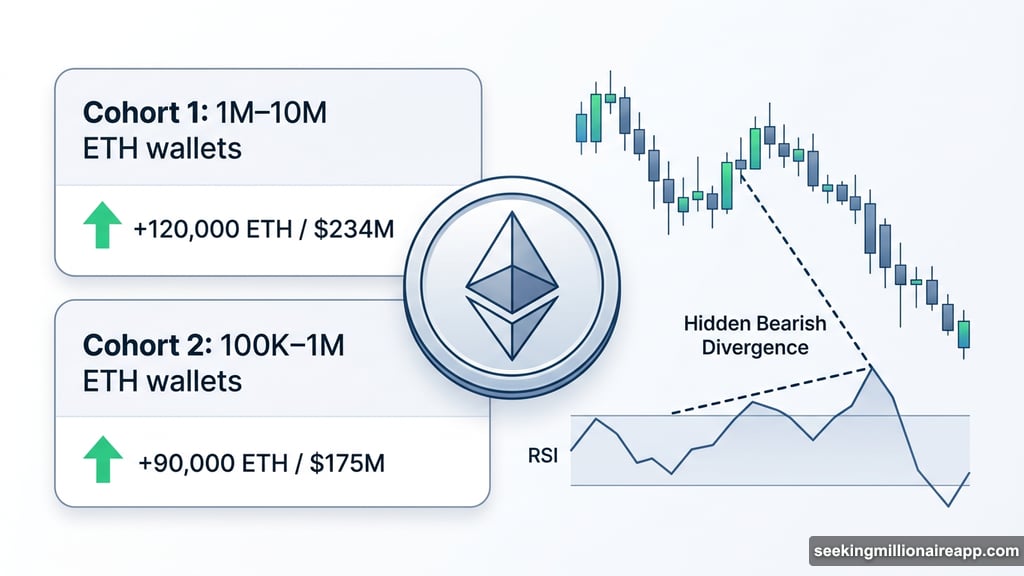
Two major groups of large Ethereum holders actually increased their positions during this period. Wallets holding between 1 million and 10 million ETH started accumulating on March 5, growing their combined holdings from 6.28 million ETH to roughly 6.40 million ETH. That’s about 120,000 ETH added, worth approximately $234 million.
A second cohort — wallets holding between 100,000 and 1 million ETH — joined the buying shortly after. Since March 6, this group added nearly 90,000 ETH, bringing their total from 11.48 million to around 11.57 million ETH. At current prices, that’s roughly $175 million worth of accumulation.
Together, these two groups absorbed a significant chunk of the selling pressure. That’s probably why ETH hasn’t collapsed further despite the founder transfer and broader bearish sentiment.
RSI Divergence and the Rising Channel Tell Different Stories
Even before the Wilcke transfer showed up, Ethereum’s chart was quietly flashing warning signs. On the 8-hour timeframe, ETH formed a hidden bearish divergence between February 14 and March 6.
During that stretch, the price created a lower high — but the Relative Strength Index (RSI), which tracks momentum, formed a higher high. That kind of divergence typically appears during downtrends and signals that selling pressure is still lurking beneath the surface, even when price briefly bounces.
At the same time, ETH has been trading inside a rising channel since February 24. That structure suggests buyers were still actively trying to build something constructive short-term. It may partly explain why certain whale cohorts kept accumulating rather than heading for the exits.
But these two signals are now in direct conflict. A break below the lower boundary of the rising channel would confirm the bearish momentum from the RSI divergence and could accelerate the sell-off.
Long-Term Holders Are Holding Strong — For Now
Beyond the whales, Glassnode data shows another encouraging signal. Long-term Ethereum holders — wallets sitting on ETH for 155 days or more — have been accumulating at a striking pace.
On February 24, the 30-day Holder Net Position Change metric showed these holders had added roughly 9,454 ETH. By early March, that figure climbed to approximately 442,646 ETH. That’s more than a 4,500% increase in under two weeks.
Long-term holders tend to act on conviction rather than short-term noise. The fact that this accumulation started around the same time ETH entered its rising channel suggests this group believes the broader structure is still intact.
Still, conviction alone doesn’t override technical pressure.
The $1,800 Level Is the One to Watch
Here’s where things sit technically. Ethereum needs to reclaim $2,050 to shift the short-term momentum. That level corresponds to the 0.618 Fibonacci retracement, and a clean 8-hour close above it could open the path toward $2,180.
On the downside, $1,910 is the critical support. A break below that level would confirm the rising channel has broken down. From there, ETH could test the $1,830 range — right on the edge of the psychological $1,800 zone that would represent a meaningful reset for the asset.
Right now, Ethereum sits between two competing forces. Founder-level selling and a bearish RSI divergence are pushing price lower. Meanwhile, whale accumulation and long-term holder conviction are providing a real floor.
Which side wins this tug-of-war matters a lot for what comes next. If whales continue absorbing sell pressure and the rising channel holds, ETH has a shot at recovery. But if the technical structure cracks at $1,910, the $1,800 zone stops being hypothetical and becomes the next destination.