The crypto market is breathing again. After weeks of choppy price action, the total market cap climbed about 1.33% over the past 24 hours, adding nearly $30 billion and pushing the overall valuation to roughly $2.28 trillion.
Bitcoin hasn’t stolen the spotlight this time around. Instead, the broader market structure is doing the heavy lifting, with select altcoins showing real momentum. And one unexpected macro factor — surging oil prices — is quietly reshaping how traders think about crypto right now.
Total Crypto Market Cap Forms a Bullish Reversal Pattern
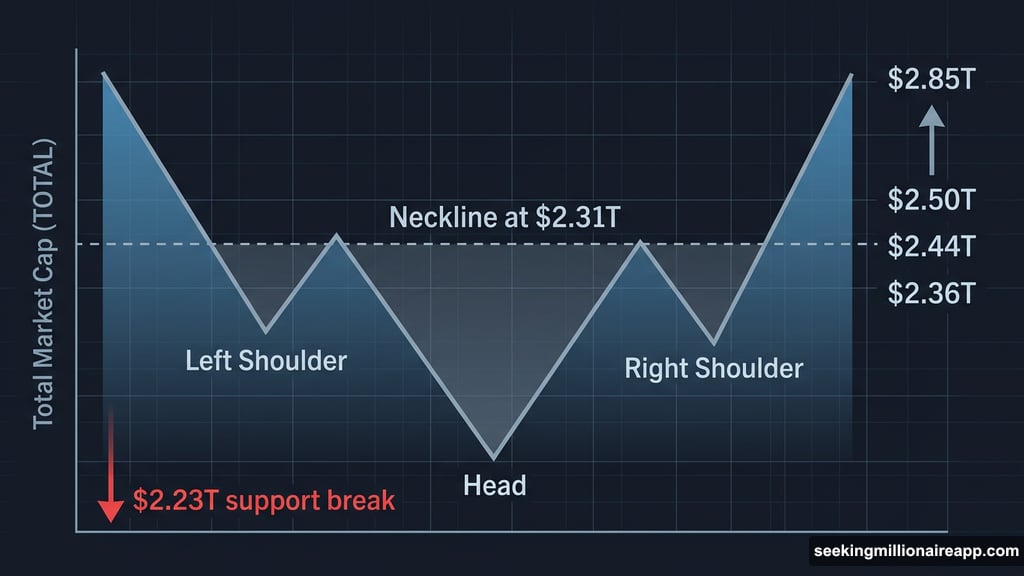
The TOTAL chart — which tracks the combined value of all cryptocurrencies — is telling an interesting story. Technically, it appears to be forming an inverse head-and-shoulders pattern. That’s the kind of chart structure traders love to see, because it often signals a meaningful price reversal from a downtrend.
Think of it like a valley with three dips. The middle dip goes lowest (the “head”), flanked by two shallower dips on either side (the “shoulders”). When prices break above the neckline connecting those shoulder peaks, it typically signals buyers taking control.
For that bullish case to play out, the market cap needs to clear $2.31 trillion first, then $2.36 trillion. Clear those two hurdles and the path opens toward $2.44 trillion and potentially $2.50 trillion. The longer-term target of $2.85–$2.87 trillion still sits well above current levels, but it’s no longer looking completely out of reach.
However, there’s a catch. If the market cap drops below $2.23 trillion on a daily close, the bullish structure weakens considerably. That would expose a deeper decline toward $2.14 trillion. So the setup is promising, but it’s not confirmed yet.
Oil Prices Above $100 Are Pushing Capital Toward Crypto
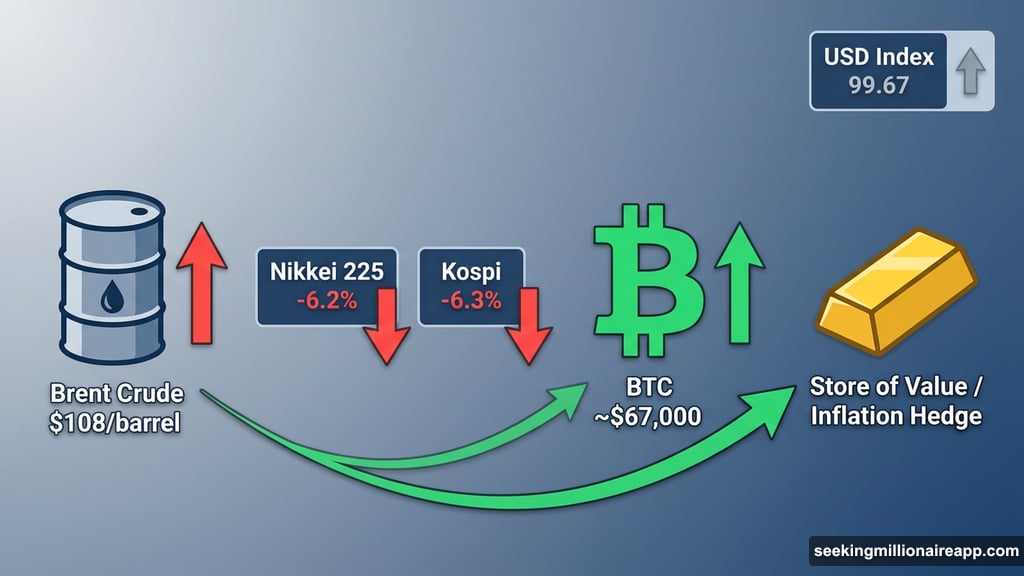
Here’s the macro twist that’s fueling some of today’s crypto strength. Brent crude surged above $108 per barrel amid escalating Iran conflict tensions, helping send Asian equity markets into freefall. Japan’s Nikkei 225 dropped 6.2%, and South Korea’s Kospi fell 6.3% — among the worst single-session losses either index has seen in years.
Meanwhile, the US Dollar Index strengthened to 99.67, briefly pressuring crypto before Bitcoin found its footing near $67,000.
So why is crypto recovering while traditional markets tank? The inflation-hedge narrative. When oil prices surge and inflation fears heat up, some investors treat Bitcoin similarly to gold — a store of value that holds purchasing power when fiat currencies face pressure.
That said, this isn’t a guaranteed relationship. The crypto-as-inflation-hedge argument is real but inconsistent. Still, it appears to be attracting capital right now, and it’s contributing to today’s resilience.
Oil trading itself is shifting into crypto territory. Data from Flash.Trade shows crude oil open interest on crypto-native derivatives platforms reached about $463,000, actually surpassing Bitcoin’s $421,770 open interest on the same platform. One whale even opened a $10.2 million 5x short on crude oil through crypto infrastructure — a signal that macro commodities and decentralized finance are converging faster than most people expected.
Bitcoin Rebounds 3% From $65,600 — But Resistance Looms
Bitcoin’s 24-hour chart looks quiet. But look beneath the surface and you’ll find something more interesting.
BTC actually bounced nearly 3% from an intraday low of $65,600, even though the close-to-close daily change appears modest. That’s a meaningful recovery that the headline number doesn’t capture.
Why did it dip to $65,600 in the first place? The likely culprit is a hidden bearish divergence that formed between February 2 and March 4. During that stretch, Bitcoin’s price formed a lower high while the Relative Strength Index (RSI) — a momentum indicator — formed a higher high. That type of divergence often signals weakening momentum and tends to precede short-term pullbacks.
The divergence played out as expected, sending Bitcoin roughly 11% lower from the March 4 swing high. Buyers then stepped in near $65,600 and pushed price back up.
The road ahead is trickier. Bitcoin faces strong resistance below $74,000 — the level needed to fully invalidate the bearish outlook. A confirmed move above that zone could open the door toward $79,000. On the downside, losing $65,600 support could expose BTC to deeper levels around $59,900.
How Bitcoin handles these levels over the coming days will likely determine whether the broader market rally has legs.
Bittensor TAO Jumps Over 9%, Leads Large-Cap Gains
While most of the market moves in cautious increments, Bittensor (TAO) is running. The AI-focused blockchain project climbed about 9.2% in the past 24 hours, making it one of the standout performers among large-cap cryptocurrencies. Ranked 45th by market cap at press time, TAO has also extended its 30-day gains to roughly 15.7%.
Technically, TAO is trading inside an ascending parallel channel — a structure that signals a controlled, sustained uptrend rather than a speculative spike. The latest surge pushed price closer to the upper boundary of that channel, raising the possibility of a breakout attempt.
TAO recently reclaimed the $193 resistance level, which had previously capped upside moves multiple times. If buyers push decisively above $198, it could trigger a channel breakout with targets at $205, then $226, and potentially $238 based on the broader pattern projection.
But support levels matter here too. A drop back below $193 weakens the momentum. The $189 zone would likely act as the next support. Losing $172 would invalidate the bullish structure entirely.
TAO’s outperformance suggests that AI-layer blockchain projects are capturing attention even during a choppy broader market. It’s one of the clearer signals that selective altcoin strength — rather than a uniform market rally — is driving today’s gains.
The crypto market rarely moves in a straight line, and today is no exception. The macro environment is genuinely complicated right now — oil shocks, geopolitical tension, and dollar strength all pulling in different directions. But the technical setups across TOTAL, Bitcoin, and TAO suggest that buyers are showing up at key levels, and that’s worth paying attention to.
Watch that $2.23 trillion floor on the total market cap. And watch $65,600 on Bitcoin. If those levels hold, the recovery narrative has a real chance of building into something more sustained.