
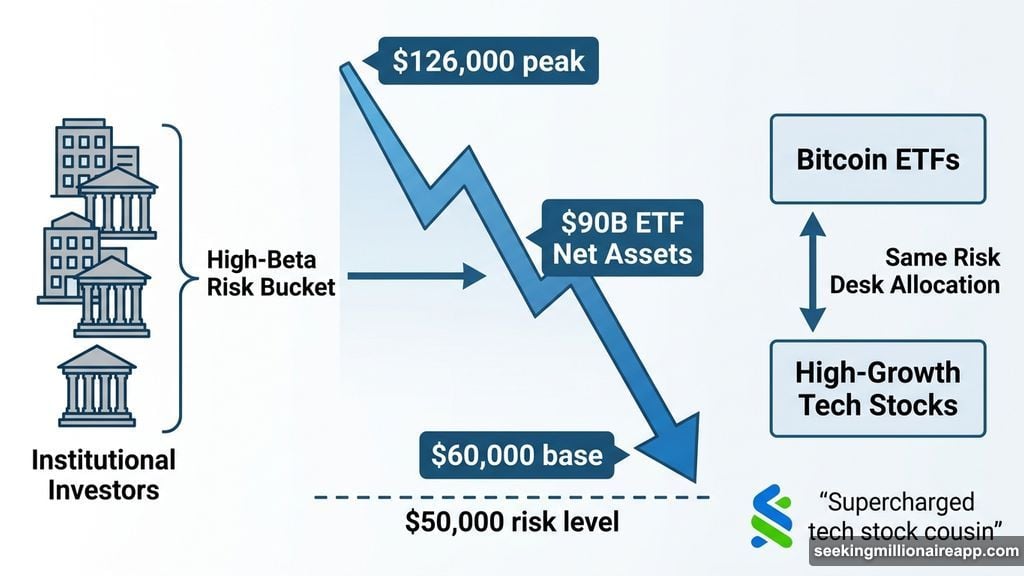
Bitcoin has dropped more than 40% from its October 2025 peak near $126,000. Institutional investors hold the key to any meaningful recovery. And the signal pointing toward that recovery isn’t what most traders watch.
BeInCrypto’s proprietary BTC-NASDAQ correlation chart, combined with monthly spot ETF flow data, reveals something striking. When Bitcoin moves in sync with tech stocks, institutional money flows in. When that link breaks, the money disappears. It’s that consistent.
Why Institutions Treat Bitcoin Like a Tech Stock
Bitcoin doesn’t pay dividends. It has no earnings reports, no cash flow metrics, and no yield for traditional portfolio managers to model. So institutions stick it in the same risk bucket as high-growth technology stocks.
Geoff Kendrick, Global Head of Digital Asset Research at Standard Chartered, explained this dynamic during a recent BeInCrypto Expert Council session. He noted that crypto traded like a supercharged version of tech stocks in 2024 during the buildup to the US election. Since then, Bitcoin has behaved more like a weaker cousin — underperforming and disappointing relative to tech.
Kendrick also flagged a potential base forming around $60,000, with $50,000 remaining a real possibility if conditions don’t improve.
This framing explains why the NASDAQ Composite matters more than the S&P 500 or Dow Jones when tracking Bitcoin’s institutional appetite. The same desks managing technology allocations are usually the ones rotating capital into Bitcoin ETFs. Their risk models treat both assets as high-beta, growth-sensitive positions that rise and fall together.
$90 Billion in ETF Assets Tells the Story
Data from SoSoValue shows US spot Bitcoin ETFs now hold over $90 billion in total net assets. Month-by-month flow data tells a clear story when you stack it against the BTC-NASDAQ correlation.
In late November 2023, the correlation entered a strong green phase. Within weeks, the first spot Bitcoin ETFs launched in January 2024, pulling in about $1.5 billion. February and March followed with $6 billion and $4.6 billion respectively, as the correlation stayed elevated with multiple peaks pressing toward 0.81.
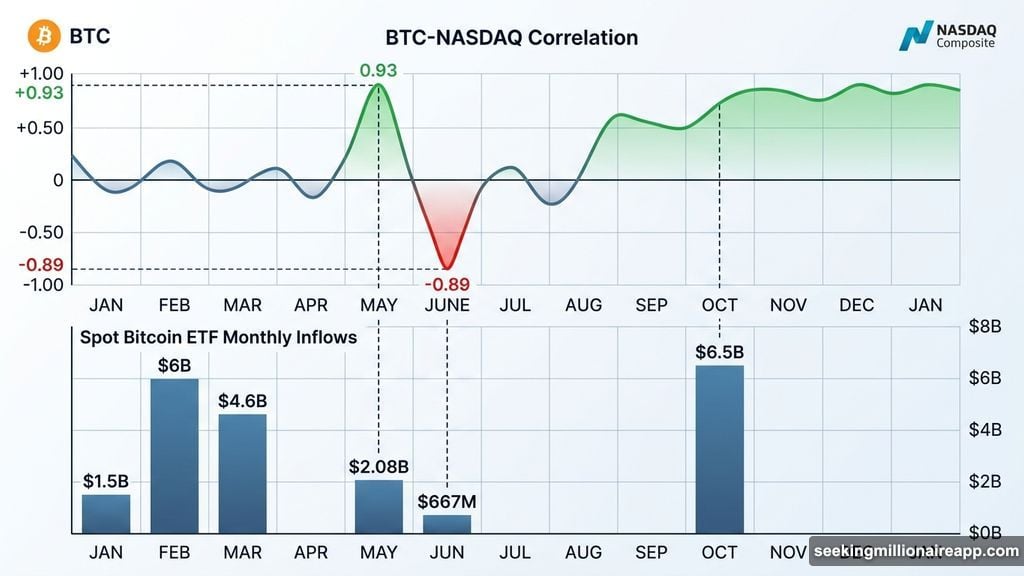
May 2024 made the pattern impossible to ignore. The correlation hit its cycle high of 0.93, and ETF inflows reached $2.08 billion — a sharp rebound following April’s $346 million outflow. Then June arrived. The correlation collapsed to minus 0.89, and inflows dropped to just $667 million. That was the weakest inflow month since the ETFs launched, despite billion-dollar months on either side.
The pattern held through late 2024. A five-month stretch of strong positive correlation between August 2024 and January 2025 aligned with consistent and growing inflows. September through January pulled in over $22 billion combined. November alone contributed $6.5 billion.
The inverse proved equally reliable. When February and March 2025 saw deep correlation dips, ETF flows turned sharply negative. Between April and July 2025, the correlation turned predominantly green again. July 2025 recorded $6 billion in inflows — setting the stage for Bitcoin’s rally toward its October 2025 all-time high near $126,000.
Global M2 Liquidity Powers the Whole Chain
The BTC-NASDAQ correlation doesn’t operate in isolation. Global M2 money supply — the total money circulating across major economies — acts as the underlying fuel for the entire system.
Research from Lyn Alden, macro researcher and founder of Lyn Alden Investment Strategy, identified a historically high correlation between Bitcoin’s price and global M2 back in 2024. VanEck estimates that M2 explains roughly 54% of Bitcoin’s price variance. That’s a significant chunk of the story.
The transmission chain works in sequence. Global liquidity expands, tech stocks rally, the BTC-NASDAQ correlation strengthens, and institutional money flows into Bitcoin ETFs. Simple in theory. Powerful in practice.
But this chain broke down in mid-2025. Global M2 has grown over 10% year-over-year, yet Bitcoin posts negative annual returns. The correlation link that converts M2 expansion into ETF inflows simply stopped functioning when the BTC-NASDAQ correlation entered prolonged negative territory between September 2025 and February 2026.
During that red stretch, ETF outflows were severe. November 2025 recorded $3.5 billion in outflows. December followed with $1.1 billion more, then January 2026 added another $1.6 billion in outflows.
Fidelity maintains that the M2 relationship will reassert itself as the global easing cycle deepens and the Federal Reserve’s quantitative tightening program winds down. The real question is whether the NASDAQ correlation will re-engage as the transmission mechanism.
March 2026 Shows Early Signs of Recovery
March 2026 has recorded $1.48 billion in ETF inflows — the first positive month since October 2025. February’s outflows also narrowed sharply to $207 million, down from $1.6 billion in January. On the surface, the chain looks like it might be reconnecting.
The correlation briefly turned green in mid-February, offering a small but meaningful signal. However, the indicator now reads minus 0.19 with a “Correlation Break” signal active. Over the past month, Bitcoin is up roughly 3.6% while the NASDAQ is down by a similar margin.
That inverse move is exactly what keeps institutional allocation models dormant. Negative correlation phases, as the historical data shows clearly, repel ETF flows rather than attract them.
The $65,700 Floor Everyone Should Watch
Bitcoin’s daily price structure near $70,600 shows a rising channel that mirrors the consolidation phase from November 2025 through early January 2026. That earlier pattern ended with a breakdown extending the decline from $126,000.
A similar fractal is now forming. The critical floor sits at $65,700. If the rising channel breaks below that level, the October-to-January fractal would repeat — and the path toward $50,000 opens up.
The global M2 decoupling remains unresolved. M2 keeps growing above 10% year-over-year while Bitcoin posts negative annual returns. The NASDAQ isn’t rallying to absorb that expansion. So the correlation can’t flip positive in the short term, and the institutional model stays switched off.
Kendrick addressed this scenario directly during the BeInCrypto Expert Council session. He noted that broader market stabilization would need to arrive first before crypto begins any gradual recovery. Without that stabilization, the same institutional timing model that powered Bitcoin’s biggest rallies could confirm a move toward $50,000 — a level Kendrick flagged as a genuine possibility rather than a worst-case scenario.
The signal to watch isn’t Bitcoin itself. It’s whether tech stocks and Bitcoin start moving together again. When that correlation flips positive and stays there, institutional money historically follows within weeks. Until then, the $90 billion sitting in Bitcoin ETFs won’t grow much, and the recovery everyone’s waiting for remains on pause.