
The crypto market is flashing red today. After a promising recovery attempt, major assets are giving back gains at levels that have historically blocked further upside.
Three charts tell the story right now: the total crypto market cap, Bitcoin, and Decred. Each one points to the same uncomfortable truth. The bulls tried. The bears pushed back hard.
Here’s what the price action looks like and what traders should watch next.
![A digital dashboard showing crypto market charts in red with Bitcoin and altcoin price indicators declining against a dark blue background]
Total Market Cap Stalls Below $2.37 Trillion Resistance
The total crypto market cap sits at $2.36 trillion today, with a session range between $2.32 trillion and $2.37 trillion.
That might sound stable. But context matters a lot here. Just six days ago, on March 16, the total market cap hit $2.54 trillion. Since then, it has dropped sharply and failed to reclaim ground.
The critical number to watch is $2.37 trillion. That level used to act as support. Now it’s acting as a ceiling. So three consecutive sessions of selling from $2.54 trillion, followed by a stall below $2.37 trillion, suggests distribution at the prior breakout zone. In simple terms, sellers are stepping in right where buyers once pushed through.
The floor below sits at $2.32 trillion. That’s the last meaningful support before open air. A daily close below that level would confirm the $2.54 trillion rally has been fully rejected and could accelerate selling toward $2.25 trillion.
On the flip side, a close back above $2.37 trillion would ease the pressure. That recovery would put $2.45 trillion back in play, and then $2.50 trillion after that. Until that happens, the structure leans bearish.
Bitcoin Loses Key Support, Eyes $65,776 Target
Bitcoin is trading at $69,236 today, up a modest 0.46% with a session high of $69,584. That small green number is a bit misleading, though.
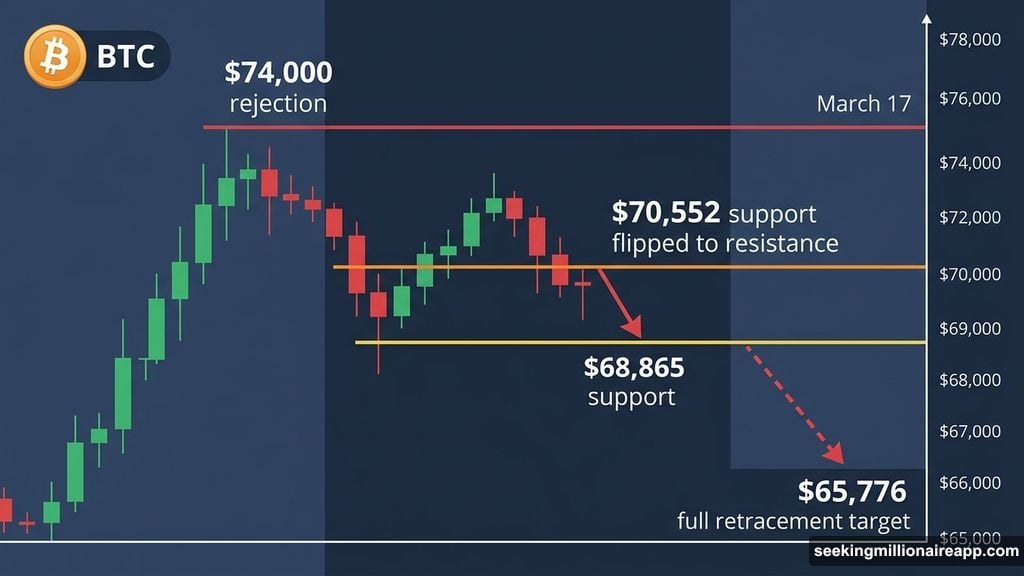
The bigger story is where Bitcoin has been. On March 17, BTC tested $74,000 and got rejected. Since that failure, price has slipped below the $70,552 support level. That level now acts as resistance from above, which is the opposite of what bulls need to see.
![A Bitcoin price chart showing the breakdown from $74,000 resistance, current consolidation near $68,865, and the potential downside target zone around $65,776]
Bitcoin is now pressing against the $68,865 horizontal floor. If buyers can’t push a daily close back above $70,552, the path toward $65,776 opens up. That lower target would represent a full retracement of the entire March rally. All those gains, erased.
The good news? A daily close above $70,552 would flip the script. That reclaim would signal buyers have taken back the breakdown zone. And from there, $74,000 would come back into view as the next test.
For now, $68,865 is the only visible structure standing between Bitcoin and a deeper slide.
Decred Breaks Fibonacci Support, Selling Pressure Builds
Decred is having a rough day. DCR is trading at $24.37, down 0.41%, after a session that saw a 7.09% loss of $1.86 in annotated selling pressure.
The key technical break happened at the 0.786 Fibonacci level at $24.68. Decred slipped below that mark and is now trading beneath it. The 20-day exponential moving average (EMA) at $25.84 is sitting just above, capping any recovery attempt.
For those unfamiliar with Fibonacci levels, think of them as natural price magnets. Traders watch these levels because assets tend to stall, bounce, or break at predictable retracement points. A break below 0.786 is a notable signal.
The next structural support below the current price sits at the 0.618 Fibonacci level at $23.36. A daily close under that number would expose $21.51, which lines up closely with the EMA at $21.95. That confluence of support could provide a stronger base.
However, a recovery above $24.68 followed by a daily close above $26.36 would cancel the bearish setup. That reclaim would bring the 1.236 Fibonacci extension at $28.21 back into range as the next upside target.
What’s Driving the Market Lower Today
Beyond the charts, two news stories are adding to the cautious mood.
First, a Nevada judge has temporarily blocked Kalshi, a popular prediction market platform, from operating in the state for 14 days. The Nevada Gaming Control Board argued the platform’s event contracts violate state gambling laws. That ruling introduces fresh regulatory uncertainty for platforms operating in the digital assets and prediction market space.
Second, Brazil is pumping the brakes on further crypto tax policy changes. The country’s Finance Minister announced that planned revisions to the crypto tax regime will be delayed until after the October 2026 presidential elections. A public consultation originally scheduled for this year could now be pushed to 2027. This follows Brazil’s June 2025 overhaul that replaced a tiered exemption system with a flat 17.5% capital gains tax across all crypto holdings, including offshore and self-custodied assets.
Regulatory headlines rarely move markets on their own. But they do shape sentiment. And right now, sentiment is fragile.
Where Things Stand
Crypto markets are consolidating after a failed breakout attempt. The total market cap, Bitcoin, and Decred all tell the same story: resistance held, support is being tested, and sellers have the short-term advantage.
None of this is a guarantee of deeper losses. A handful of strong daily closes above key resistance levels could flip the setup quickly. But until buyers reclaim those levels, the charts favor patience over aggression.
Watch for Bitcoin to either defend $68,865 or lose it. That single data point will likely set the tone for the rest of the week.