Four weeks. Two billion dollars. That’s what US spot Bitcoin ETFs have pulled in during their longest weekly inflow streak of 2026.
And BlackRock is carrying most of the weight. The asset management giant’s iShares Bitcoin Trust (IBIT) alone accounted for roughly $1.7 billion of that total. So when people talk about institutional money returning to Bitcoin, they’re largely talking about BlackRock writing some very large checks.
What does this streak actually mean for Bitcoin’s price and where things might be heading? Let’s dig in.
BlackRock’s IBIT Dominates the 2026 Inflow Story
Four consecutive weeks of positive flows might not sound dramatic. But context matters here.
According to data from SoSoValue, this current run marks the most sustained period of institutional buying since the August-September 2025 window. During that earlier stretch, Bitcoin ETFs pulled in more than $3.8 billion in fresh capital. So while this year’s pace is more modest, the consistency signals something real.
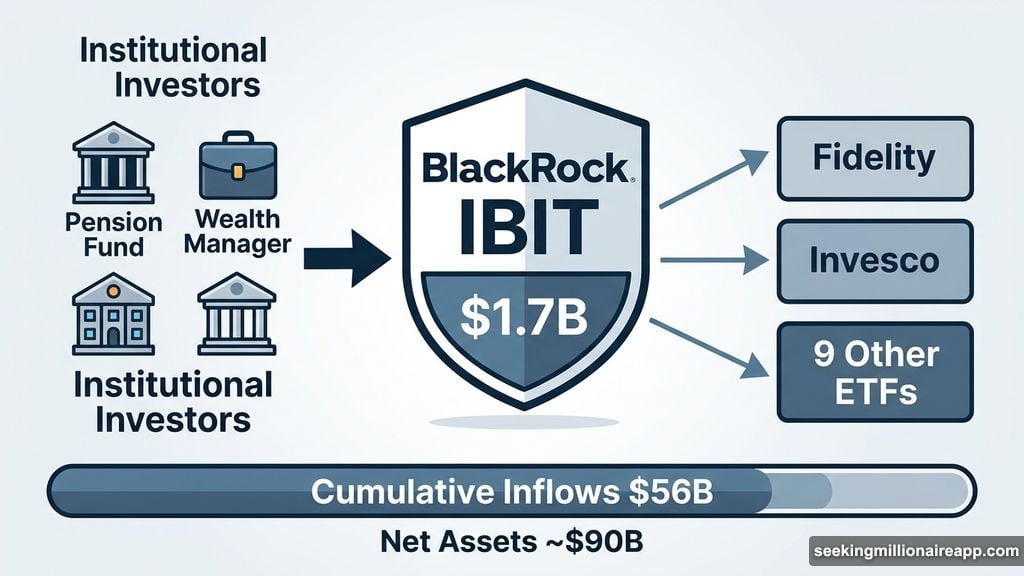
Since their landmark debut in January 2024, the 12 US-listed spot Bitcoin ETFs have now collected more than $56 billion in cumulative inflows. The group manages about $90 billion in net assets today. That’s not speculation money. That’s serious institutional capital sitting in regulated investment vehicles.
BlackRock’s IBIT continues to stand apart from the pack. Its dominance reflects a broader trend where institutional investors gravitate toward the most recognizable, most liquid products. When a pension fund or wealth manager wants Bitcoin exposure, IBIT is typically the first call they make.
Bitcoin Holds Near $70,000 Despite Real Headwinds
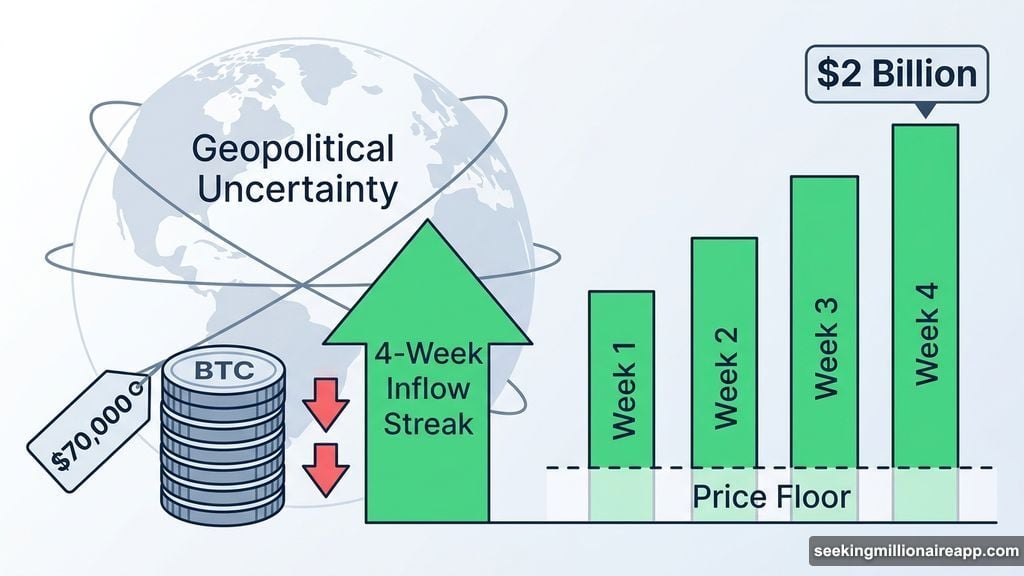
Here’s what makes this inflow streak particularly interesting. Bitcoin has stayed resilient near $70,000 despite some genuinely difficult conditions.
Geopolitical tensions in the Middle East have been escalating. Historically, that kind of global uncertainty pushes investors toward traditional safe-haven assets like gold or US Treasury bonds. Bitcoin doesn’t always benefit from those flight-to-safety moves.
But this time, ETF demand appears to be providing a meaningful price floor. Sustained institutional buying absorbs selling pressure. So even as macro uncertainty swirls, the consistent inflows have helped keep BTC from falling further.
That’s actually a significant development in how Bitcoin behaves as an asset. It suggests the ETF product layer has matured enough to provide real structural support, not just speculative momentum.
What Analysts Say About the $100K Question
Before anyone starts celebrating a run toward $100,000, macro research platform Ecoinometrics is urging some patience.
“The direction is now unambiguous, but we are still far from a complete recovery. Even in bullish simulations, this kind of demand typically translates into a slow rebuilding phase,” the firm noted in a recent analysis.
Their near-term view? A 30-day target range around $80,000 looks more realistic than a sprint toward six figures. That’s still meaningful upside from current levels. But it suggests a gradual recovery rather than an explosive move higher.
The more important point Ecoinometrics raised is what the ETF demand shift actually represents. They described it as a transition from a market headwind to a foundational support level. That framing matters. Early in the ETF era, outflows from these products added selling pressure. Now, consistent inflows are stabilizing prices instead.
Why This Inflow Streak Feels Different
Not all inflow streaks are created equal. Some reflect short-term speculation chasing price momentum. Others indicate deeper, more structural positioning.
This one has characteristics of the latter. The pace is slower and steadier than previous surges. It’s coming despite geopolitical noise, not because of a calm macro environment. And it’s being driven by the largest, most institutionally credible product in the space.
Plus, the broader context of $56 billion in cumulative inflows since 2024 suggests this isn’t a new story. It’s a maturing one. Institutions have been building Bitcoin positions through regulated ETF wrappers for over two years now. The 2026 streak represents continuation, not a brand new trend.
Still, Ecoinometrics’ framing deserves respect. Recovery phases after drawdowns tend to be slow and choppy, even when the underlying direction turns positive. Patient accumulation rarely feels exciting in real time. But it tends to set the stage for what comes next.
Whether that next phase involves $80,000, $100,000, or something entirely different depends on how long this institutional buying appetite holds up.