The crypto market just pulled off a sharp recovery, and the trigger had nothing to do with blockchain technology or token launches. It came straight from geopolitics.
President Trump announced a five-day pause on planned strikes against Iran’s energy infrastructure on March 23, describing ongoing talks as “very good and productive.” Financial markets reacted instantly. Bitcoin jumped from below $68,000 to above $71,000 within hours, and the total crypto market cap clawed back $74 billion in a single session.
So what exactly happened, and does the recovery have legs? Let’s walk through it.
Geopolitical Relief Sparked a Risk-On Rally
When tensions ease in the Middle East, energy markets move fast. And when energy markets move, everything else follows.
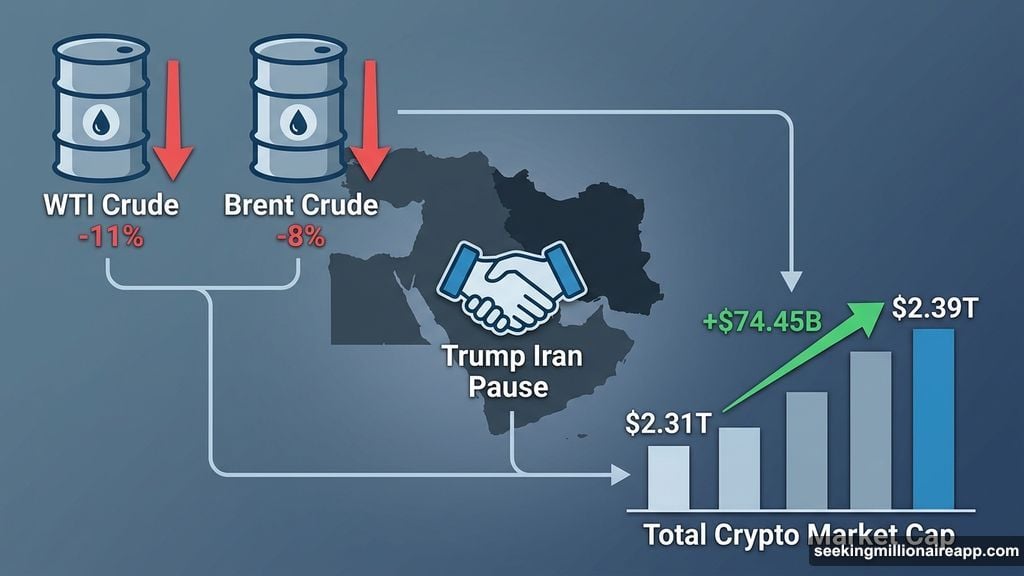
WTI crude oil fell 11% on the Iran pause news. Brent crude dropped 8%. That collapse in oil prices directly removed two fears that had been dragging crypto lower for weeks: inflation pressure and supply chain disruption.
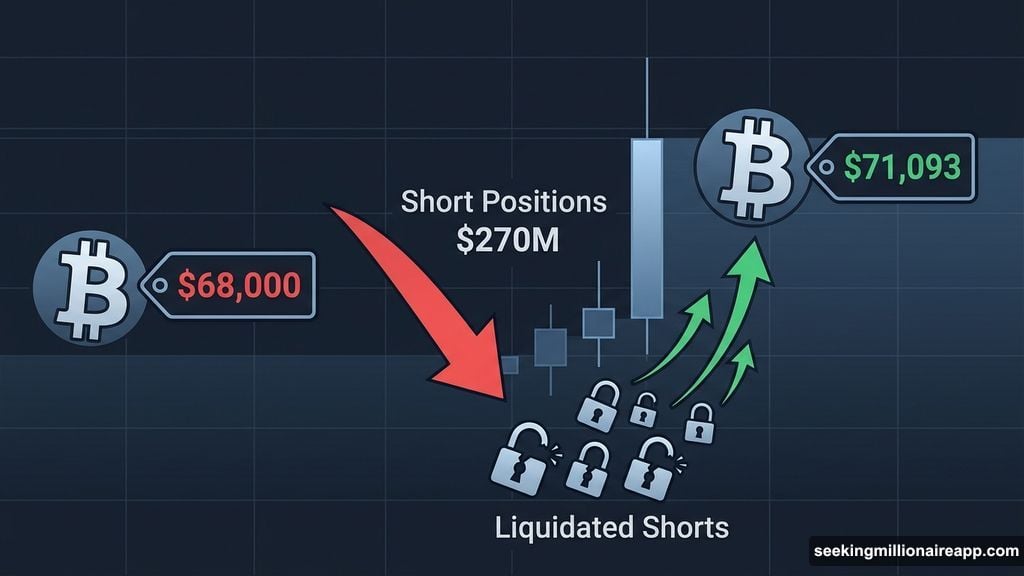
Investors who had been sitting cautiously on the sidelines shifted back into risk assets. Bitcoin was one of the biggest beneficiaries. The price moved from sub-$68,000 territory to a session high of $71,093 within the same trading window.
Plus, there was a mechanical boost layered on top of the sentiment shift. Over $270 million in Bitcoin short positions were liquidated during that same move. When shorts get squeezed, prices climb even faster than the underlying buying pressure would suggest. That liquidation cascade added serious fuel to the rally.
The Total Crypto Market Cap Recovery
Before March 23, the numbers weren’t pretty. Total crypto market capitalization sat near $2.31 trillion on March 22, its lowest point since mid-February. The market had been grinding lower since March 16, when the total stood at $2.55 trillion.
The Trump announcement sparked a 3.22% single-session recovery. That added roughly $74.45 billion and pushed the total market cap back to approximately $2.39 trillion.
Now the chart shows a clear reversal candle sitting right at a decision point. The $2.40 trillion level is the immediate resistance to watch. A close above it would signal the low is likely in. Beyond that, recovery targets sit at $2.50 trillion and $2.57 trillion.
On the downside, a drop back to $2.32 trillion or below would suggest the bounce was just a temporary relief trade, not a genuine trend reversal.
Bitcoin Price Analysis: Strong but Not Overbought
Bitcoin is trading at $70,516 as of this writing, consolidating just below the $70,552 resistance level. The session high of $71,093 marked the immediate ceiling before some selling came in.
The Money Flow Index reads 70.13. That number matters because it tells you where buying pressure stands relative to its limits. The overbought threshold sits at 80. So the MFI has been rising steadily since late January but hasn’t yet hit the danger zone. That means buyers are active and committed, but there’s still room to push higher before the market gets technically stretched.
The $68,865 level held as a floor during the March 22 sell-off. That now acts as support on any pullback.
However, there’s a catch worth noting. Iran’s Fars news agency pushed back on Trump’s description of the talks, stating no meaningful progress had been made. That contradictory headline pulled Bitcoin back from $71,093 toward the $70,500 range. It explains why BTC still shows a slight daily loss despite the strongly positive session overall.
If bullish momentum continues from here, the next meaningful target is $74,000. If Iran tensions reignite and risk-off sentiment returns, Bitcoin could pull back to the $65,776 support zone.
Fetch.AI Shows Its First Positive Signal Since February
The Artificial Superintelligence Alliance token, trading as FET, posted a 2.47% gain and hit $0.2324. That puts it just above the Fibonacci 0.786 level at $0.2318, which is a technically meaningful position.
But the more interesting signal comes from the Chaikin Money Flow (CMF) indicator. The CMF just turned positive at +0.05. That might sound tiny, and it is. But it’s the first positive CMF reading since February.
What does that actually mean in plain terms? For the first time in weeks, buyers are ending trading sessions in the upper half of the daily price range with meaningful volume behind them. It’s a fragile shift, but it points in a positive direction.
If FET holds above the 0.786 level at $0.2318, the next Fibonacci target is the 1.0 extension at $0.2569. That’s roughly 10% above current prices. The key floor to watch on the downside is $0.1965. A break below that level on any Iran-related reversal would put the whole recovery picture back into question.
What the News Cycle Is Watching
Two other stories are shaping market sentiment alongside the Iran development.
Japan’s Liberal Democratic Party launched a dedicated project team to build a national framework for AI-powered on-chain finance. The move signals that Tokyo now treats blockchain-based financial infrastructure as a structural economic priority, not just a niche regulatory topic. That kind of institutional signal tends to build long-term confidence in the space.
On the negative side, Balancer Labs announced it is shutting down operations. Co-founder Fernando Martinelli cited the corporate entity itself as a liability following a $128 million exploit in November 2025 that targeted V2 vaults across Sonic, Polygon, and Base networks. The Balancer protocol must now figure out how to move forward without its founding company behind it.
What Happens Next
The honest answer is that this recovery depends heavily on a news story that could flip direction fast.
The Iran situation remains genuinely uncertain. If talks progress and geopolitical pressure continues to ease, Bitcoin’s path toward $74,000 looks reasonable. Risk appetite stays elevated, oil prices stay suppressed, and inflation fears stay quiet.
But if the Iran pause collapses or tensions escalate again, the same mechanism that drove this rally could work in reverse. Oil prices spike, inflation fears return, and risk assets including crypto sell off hard.
For now, the technical setup looks constructive. The total market cap held a key support level, Bitcoin’s MFI shows buying pressure without hitting overbought extremes, and FET’s first positive CMF in weeks adds a small but real confirmation signal.
Watch the $2.40 trillion level on total market cap and $70,552 on Bitcoin. How price behaves at those resistance zones over the next few sessions will tell you whether this is the start of something or just a one-day relief trade.