
Ethereum just reclaimed a critical technical level, and whale wallets are loading up fast. But two on-chain signals suggest this rally faces a much tougher ceiling than the last one.
The setup looks familiar on the surface. But dig into the data, and the story gets more complicated.
The 20-Day SMA Reclaim That Sparked March’s Big Move
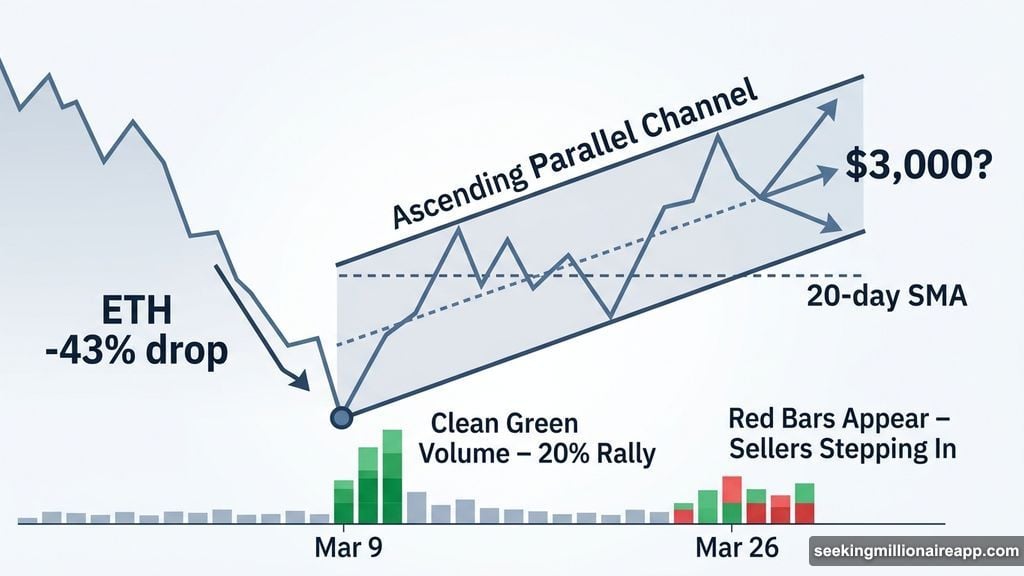
ETH has been trading inside an ascending parallel channel since February 6. That channel formed after a brutal 43% drop from the January 28 swing high.
Here’s the thing about ascending channels that follow steep sell-offs. They don’t automatically mean recovery. They often act as continuation patterns, meaning the downtrend isn’t over yet. ETH needs to break convincingly above the upper trendline to confirm a genuine trend reversal.
On March 9, Ethereum reclaimed the 20-day Simple Moving Average (SMA), basically a rolling average of the last 20 daily closing prices. That reclaim triggered a clean 20% rally, pushing ETH up to roughly $2,380 by March 16. Crucially, that entire move happened with consecutive green volume bars. Buyers were in full control throughout.
The current reclaim looks different. Volume started decent, but red volume bars have already appeared on the March 26 candle. Red bars mean sellers are stepping in during the rally, something that was completely absent back on March 9. The candle is still forming, so a strong late-session push could change the picture. But right now, the volume story doesn’t match the previous breakout’s confidence.
NUPL Shows Sellers Are Waking Up
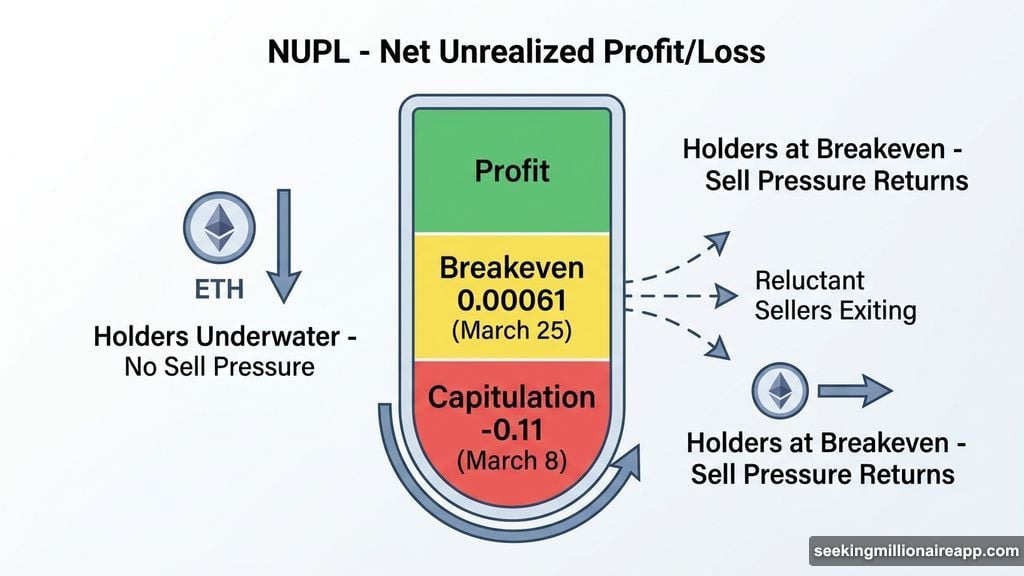
Volume tells you what’s happening. Net unrealized profit/loss (NUPL) tells you why.
NUPL tracks the aggregate profit or loss position of all Ethereum holders across the network. When it sits deep in negative territory, most holders are underwater and have little reason to sell. That’s exactly where it was on March 8, sitting at roughly -0.11, deep inside the capitulation zone.
At that level, sell-side pressure essentially evaporated. Nobody sells at a big loss unless they’re panicking, and panic had already passed. So when the SMA reclaim happened, there was almost nobody left to sell into the rally. The move ran to $2,380 with minimal resistance.
Fast forward to March 25. NUPL now sits at 0.00061, barely positive. That tiny number carries a big implication. Holders who were deeply underwater in early March have clawed back to breakeven. Some are now at the exact price they paid. And when people reach breakeven, they often sell, not to book profits, but simply to escape a position that stressed them out.
Before the current reclaim, on March 22, NUPL was already at -0.05, well above the capitulation lows that set up March’s rally. So the cushion of underwater, reluctant sellers that fueled the previous move is largely gone. This time, ETH is pushing into a zone where people are starting to feel relief, and relief often turns into selling.
Whales Bought 900,000 ETH in Two Days
Here’s where the bull case gets its strongest support.
According to Santiment data, large non-exchange Ethereum wallets increased their collective holdings from 121.72 million ETH to 122.62 million ETH between March 24 and March 26. That’s roughly 900,000 ETH added in just two days, worth about $1.94 billion at current prices.
That’s not noise. That’s conviction from the wallets that move markets.
But there’s an important caveat. Whale accumulation in early March was noticeably more aggressive. That aggressive buying was a key reason the previous rally ran a full 20% even as NUPL climbed. This time, whales are buying, but not at the same intensity. One reading of this is that large holders might be waiting for a price confirmation before committing bigger positions. If ETH can close above key resistance, the next wave of whale buying could accelerate the move.
The Realized Price Barrier at $2,350
The most important number for Ethereum right now sits between $2,330 and $2,410.
Ethereum’s realized price, which represents the average cost basis of every coin on the network according to Glassnode, currently sits at around $2,350. That places it right in the middle of this critical confluence zone. The realized price tends to act as a strong support or resistance level during volatile markets, because it represents where the average holder either feels relief or pain.
A daily close above $2,410 would accomplish three things simultaneously. It would push ETH above the realized price, making the average holder feel positive about their position. It would clear the 0.618 Fibonacci resistance level. And it would surpass the $2,380 swing high that capped the March rally.
If that close happens, the next resistance levels stack up at $2,520, then $2,650, and finally the 1.618 Fibonacci extension at $3,050. So yes, the $3,000 target remains mathematically in play.
On the downside, the first line of defense is $2,160. A daily close below that level signals buyers from the SMA reclaim are stepping away. Below that, $2,010 is the next major floor. A break there reopens the risk of a move back below $2,000.
What Actually Happens Next
The honest answer is that this setup is more complicated than March’s version.
Back then, nearly everyone was underwater, whales were loading aggressively, and volume confirmed every push higher. This time, NUPL is near zero with fresh sell pressure emerging, whale buying is present but more measured, and volume is already showing some red flags.
The $2,410 close is the line that matters most. Above it, the rally has real legs toward $3,000. Below it, this looks more like a fade back toward the channel floor, and the whole setup needs to reset before another genuine attempt.
Watching volume closely over the next few sessions will tell you a lot. Green volume bars returning and sustaining would meaningfully shift the odds. Red bars holding or increasing would confirm the resistance is doing its job. Either way, the next few daily closes should clear things up quickly.