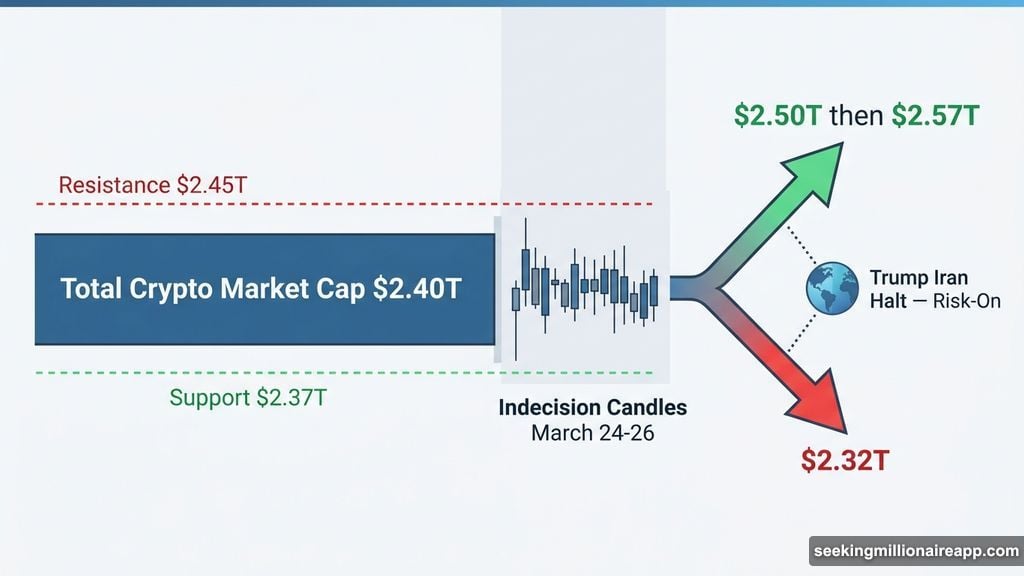
The total crypto market cap is sitting comfortably above a key support level right now. As of March 26, 2026, the market is holding around $2.40 trillion, sandwiched between $2.37 trillion support below and $2.45 trillion resistance above.
So what’s driving the positive mood? A lot of it comes down to a geopolitical shift. President Trump’s announced halt on Iran strikes sparked a risk-on attitude across financial markets, and crypto benefited right along with everything else. Meanwhile, Bitcoin is holding its ground, and one altcoin just made a jaw-dropping single-day move.
Let’s walk through what the charts are actually showing.
Crypto Market Cap Consolidation Signals Quiet Strength
The total crypto market cap has been trading in a tight range since March 24. That tight range isn’t necessarily a bad thing. In fact, it often signals that the market is catching its breath before making a bigger move.
The $2.37 trillion level has acted as solid support across multiple tests, most notably during the lows on March 21 and 22. Sellers stepped back in around $2.45 trillion on March 24, capping that session before buyers could push higher.
For bulls to take control, the market needs a daily close above $2.45 trillion. That would open the path toward $2.50 trillion first, then $2.57 trillion. On the flip side, losing $2.37 trillion would shift the focus down to $2.32 trillion, the next visible support below.
Right now the small-bodied candles on the daily chart tell a story of indecision, not reversal. That’s a meaningful distinction. The market isn’t falling apart. It’s just waiting for a catalyst.
Bitcoin’s Money Flow Index Points Toward Building Momentum
Bitcoin is trading at $70,770 as of March 26, holding comfortably inside a range that has been intact since March 19. The lower boundary sits at $68,830 and the upper resistance sits at $72,294.
What makes this consolidation interesting is what’s happening beneath the surface. Bitcoin’s Money Flow Index (MFI) currently reads 68.34. That number is approaching the 80-level overbought threshold but hasn’t reached it yet. More importantly, the MFI has been trending steadily upward since March 8.
That steady upward trend in MFI tells us something valuable. Even during sideways price action, capital has been consistently flowing into Bitcoin. Buyers are not abandoning the trade. They’re just being patient.
The $70,000 level marked by analysts is the immediate battleground. A daily close above $72,294 would put $75,000 squarely in play. However, a break below $68,830 shifts attention down to $66,224, with the $65,000 level serving as the final line of defense for bulls.
![Bitcoin price analysis chart showing MFI at 68.34, price holding above $68,830 support with resistance at $72,294 on the daily timeframe]
Memecore Fibonacci Extensions Target $2.59 and $2.66
If Bitcoin is being patient, Memecore (M) is doing the opposite. The token surged 39.62% on March 25, printing one of the more dramatic single-day breakouts in recent altcoin history.
The move broke decisively above the prior consolidation zone between $1.64 and $1.89. That’s not a subtle breakout. That’s a cannon shot through resistance.
The Fibonacci extension grid now places meaningful targets at $2.34 at the 1.5 level and $2.66 at the 2.0 level. Both are within striking distance given the momentum behind the move. Plus, the 20-day exponential moving average (EMA) sits at $1.76, now well below current price after the breakout candle. The EMA had been rising steadily throughout March, which confirms the uptrend structure was quietly building before the explosive move happened.
For the bullish thesis to stay intact, Memecore needs to defend the $1.64 horizontal support on any pullback. A daily close below that level would invalidate the breakout and open the door back toward the Fibonacci zero level at $1.39. But as long as $1.64 holds, the momentum story remains compelling.
Two News Stories Worth Watching
Beyond the charts, two stories caught attention today. First, FiscalNote Holdings lost its NYSE listing on March 25 after failing to maintain the $1.00 minimum share price threshold. The company had already attempted a reverse stock split with no remaining cure period available. The delisting reflects a broader challenge for policy intelligence platforms, as large language models now deliver similar insights without a subscription.
Second, blockchain investigator ZachXBT confirmed that Circle unfroze the USDC balance in one wallet previously targeted from a group of 16. Specifically, the wallet tied to Goated.com regained access to its 130,966 USDC. Additional affected wallets may be restored soon, though the underlying U.S. civil case that triggered the original freeze has not been publicly disclosed.
Where Things Stand
The crypto market right now feels like a coiled spring. The total market cap is holding support with quiet confidence. Bitcoin’s capital inflows are building even while price consolidates. And Memecore just showed what altcoin season breakouts look like when momentum aligns.
The geopolitical tailwind from the Iran strike halt gave markets a reason to relax. Whether that reason holds depends entirely on how events develop from here. For crypto specifically, the key levels are clear and the structure looks constructive.
Watch for that daily close above $2.45 trillion on the total market cap. That single data point would tell you more about the next two weeks than any headline will.