
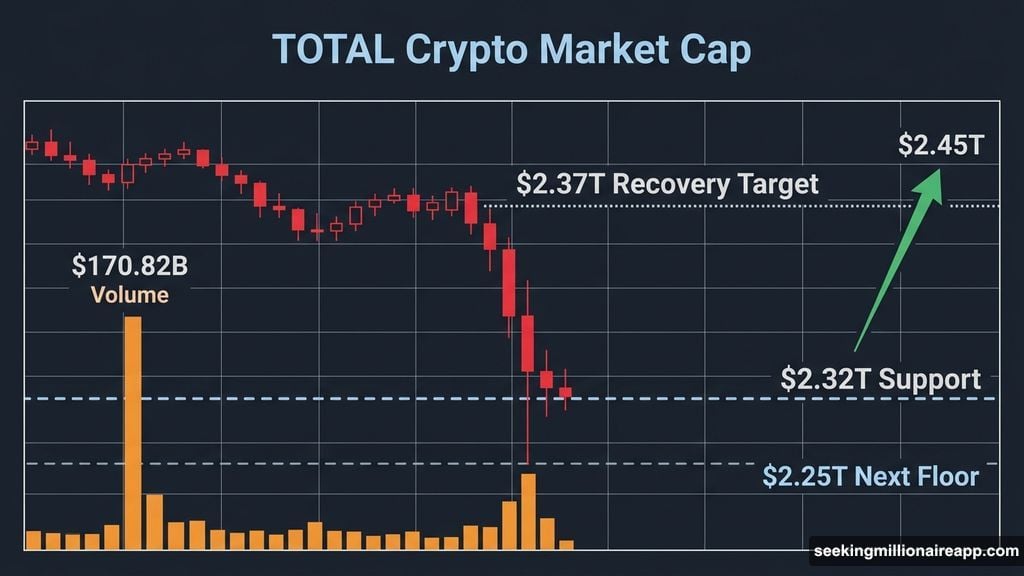
The crypto market had a rough March 26. In just one session, the total market cap dropped 3.32%, wiping out $80.21 billion and pushing the market down to around $2.34 trillion.
What made this drop different from a quiet drift lower? Volume. Trading activity came in at $170.82 billion, well above recent sessions. That tells you real sellers were driving the move, not just thin liquidity making prices look worse than they are.
Bitcoin stumbled near a key level, and one smaller token had an absolutely brutal day. Here’s what the charts are actually showing.
The $2.32 Trillion Support That Really Matters
The total crypto market cap, tracked as TOTAL on charting platforms, closed the March 26 session pressing right on the $2.32 trillion support zone. This level had held steady through the prior week, which makes it significant now.
If TOTAL breaks below $2.32 trillion and stays there, the next visible floor sits at $2.25 trillion. That would represent a deeper correction from current levels, and there isn’t much cushion between those two zones.
On the flip side, a daily close back above $2.37 trillion would neutralize most of the damage from March 26. From there, a recovery toward $2.45 trillion becomes the realistic near-term target. But bulls need to defend $2.32 trillion first to keep that scenario alive.
![Wide-angle editorial-style image of a digital market display showing red downward charts representing a crypto market decline, with blue and orange accent lighting]
Bitcoin Clings to a Trendline at $68,805
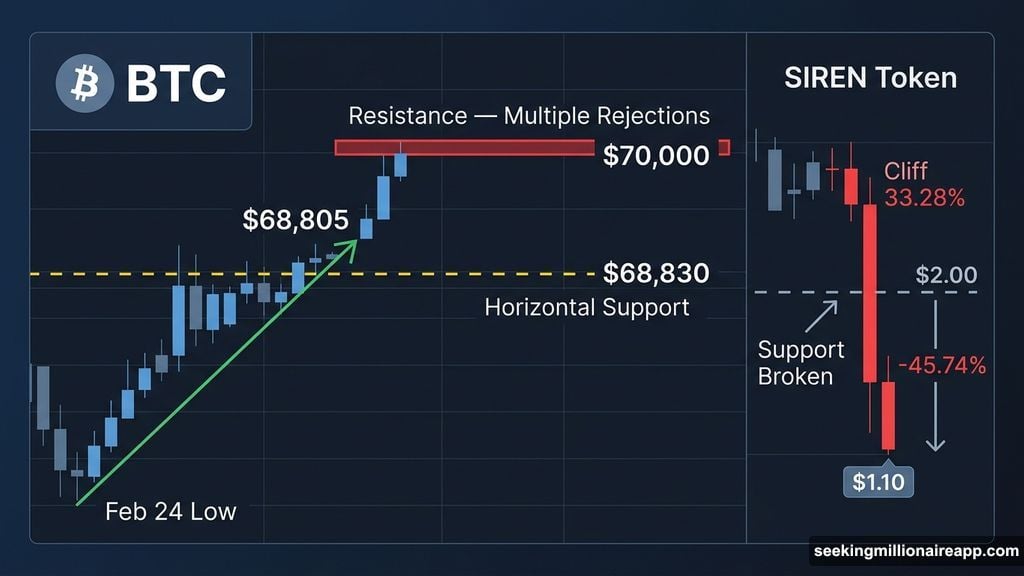
Bitcoin is trading at $68,805 as of March 27, sitting just below the $68,830 horizontal support level that’s been visible on the daily chart. The session low touched $68,531, which pressed directly onto an ascending trendline that’s been holding price up since the February 24 low.
So Bitcoin is balancing on two support structures at once. That sounds encouraging, but the resistance picture is less friendly.
The $70,000 level keeps rejecting every rally attempt. Bitcoin has tried to reclaim it multiple times since March 19, and each attempt has failed. Until that changes, the bearish momentum from this pullback stays intact.
Below current price, the $66,224 horizontal support is the next significant floor if the trendline gives way. A clean break below that opens the door to $65,000. But a daily close above $70,000 would flip the script entirely, putting $72,294 back in focus as the next upside target.
Siren’s 33% Single-Day Collapse
While Bitcoin’s situation is tense, Siren (SIREN) had a far more dramatic session. The token dropped 33.28% on March 27 alone, and over the past 24 hours the total drawdown from its recent peak reached 45.74%.
SIREN is now trading around $1.10. The $2.00 level, which had acted as horizontal support since March 22, broke cleanly during the current session. That’s a significant breach because support levels that hold for multiple days tend to matter when they fail.
The next visible support sits at $0.94. That level actually served as resistance during a March consolidation phase before SIREN broke out, which means it’s a meaningful price point rather than an arbitrary number. A hold there would be the first real sign of stabilization.
![Close-up editorial illustration of a downward-trending price chart for a crypto token with red candlesticks and highlighted support levels at $0.94 and $2.00]
If SIREN reclaims $2.00 on a daily close, the breakdown looks more like a sharp washout than a lasting trend reversal. The all-time high at $4.72 would remain the longer-term upside reference in that case. Below $0.94, the next floor on the chart drops all the way to $0.46.
What Else Happened in Crypto This Week
Beyond the price action, two pieces of news stood out this week.
BitGo Holdings posted its first earnings as a public company, reporting full-year 2025 revenue of $16.15 billion. That’s a 424% year-on-year increase, driven by higher digital asset trading activity and the launch of its Stablecoin-as-a-Service product. Fourth-quarter revenue alone came in at $6.16 billion, a 440% jump, with full-year adjusted EBITDA reaching $32.4 million, up 188% from the prior year. Those are striking numbers for a company reporting publicly for the first time.
Meanwhile, Stand With Crypto, the advocacy group backed by Coinbase, announced a voter mobilization campaign ahead of the November midterms. The initiative targets swing states like Arizona and Pennsylvania, focusing on crypto-friendly candidates. The group is launching a voter hub that displays where candidates stand on blockchain and digital asset issues, along with a questionnaire designed to vet politicians directly on these topics.
What to Watch Next
The market is sitting at a decision point. Three key levels will tell you most of what you need to know in the days ahead.
For the total market cap, $2.32 trillion is the line in the sand. For Bitcoin, $70,000 remains the resistance that needs to break for sentiment to improve. And for SIREN, $0.94 is the stabilization test that matters right now.
None of these are guarantees in either direction. Elevated volume on the March 26 decline confirms real selling pressure existed. But support levels often hold precisely because traders recognize them, and each of these zones has been relevant before.
The next few daily closes will give a much clearer picture of whether this is a pullback within a broader trend or the start of something more extended.