
After six brutal months in the red, Ethereum is clinging to its first green month since August 2025. The question is whether it can hold on.
March gave ETH a 2.93% gain. That sounds modest, but after losing more than half its value across six consecutive monthly closes, any green number feels significant. The trouble is, the second half of March has been quietly eating away at those gains. And with only days left in the month, the pressure is building fast.
Six Straight Red Months Tell a Painful Story
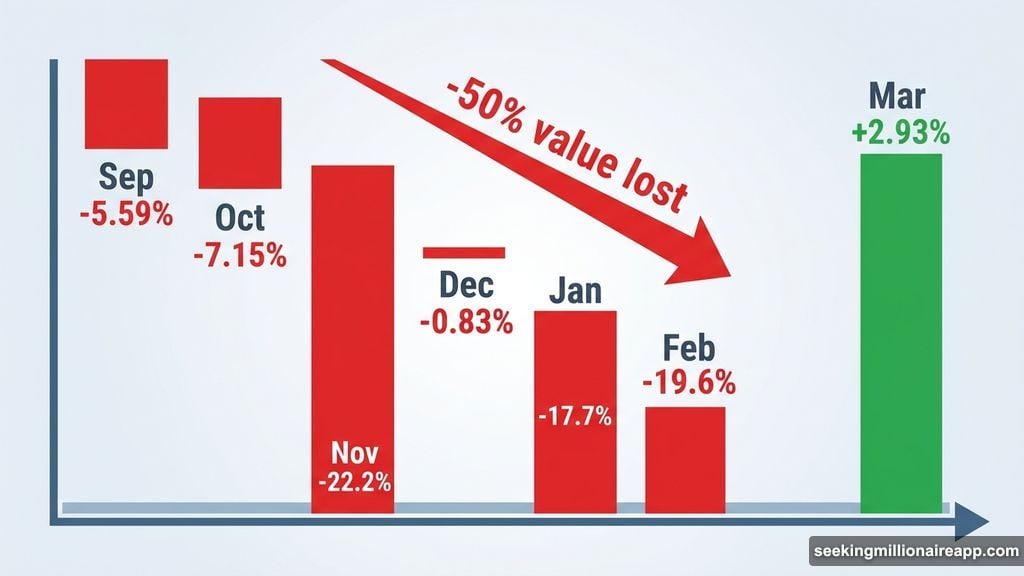
The monthly returns chart makes for grim reading. September 2025 dropped 5.59%. October fell 7.15%. November was the worst, crashing 22.2%. December slipped 0.83%. Then January 2026 shed another 17.7%, followed by February losing 19.6%.
That six-month losing streak wiped out more than 50% of ETH’s value. So March’s slim 2.93% gain stands alone in green, but it masks a troubling pattern underneath.
The first half of March delivered nearly all those gains. The second half has been steadily giving them back.
A Falling Channel Has Ethereum Trapped
Since March 16, when Ethereum peaked at $2,380, the price has been sliding inside a 4-hour falling channel. That channel pushed ETH as low as $1,970, a correction of roughly 18% from the mid-March high.
Right now, ETH sits near $2,020. Still inside the channel. Still trending lower.
If the channel continues to compress price toward its lower boundary, the final days of March become critical. Either Ethereum holds its gains and breaks a painful six-month streak, or it folds and extends that streak to seven.
Two key metrics suggest the bears are gaining momentum heading into month-end.
Ethereum Whale Activity Raises Red Flags
Whale wallets holding ETH, excluding exchange addresses, fell by roughly 180,000 ETH in just 48 hours. That balance dropped from 122.91 million ETH to 122.73 million. The timing is concerning because it coincides directly with the price sliding toward the bottom of the falling channel.
When large holders start offloading that quickly, it signals weakening conviction at the top of the market.
But the whale data isn’t the only warning sign.
Dip Buyers Are Losing Interest
The Money Flow Index (MFI), a volume-weighted momentum indicator that tracks buying pressure, is showing a bearish divergence. Between March 8 and March 28, Ethereum’s price trended higher on the 4-hour chart. But the MFI trended lower during that same window.
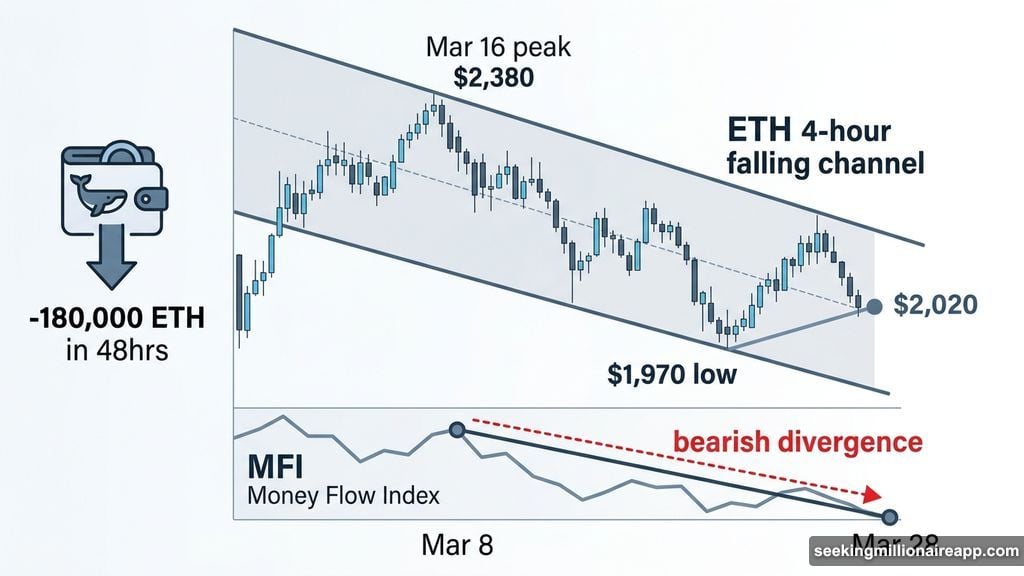
In plain terms, each dip attracted less buying volume than the one before it. Dip-buying support has been weakening throughout March, even while the monthly price action stayed technically green.
When whales are reducing their positions and dip buyers are losing conviction at the same time, the floor beneath the current price gets thinner. If broader market conditions keep softening, Ethereum may not have enough demand to defend its March gains.
The $1,970 Zone Is Everything Right Now
The critical level to watch is $1,972, widely referred to as the $1,970 zone. This area has held as support since early March. It also sits at the 0.618 Fibonacci retracement level, which makes it technically significant.
A 4-hour close below $1,970 would be a serious signal. It would break the strongest current support and push ETH closer to the falling channel’s lower boundary. Below that, $1,910 and $1,830 come into play quickly.
A clean break under $1,830 would confirm a full channel breakdown. The projected drop from that level targets the $1,650 zone, roughly another 10% lower. That kind of move may not happen overnight, but the path toward it is becoming clearer.
On the upside, Ethereum needs to reclaim and hold above the $2,050 zone to relieve the immediate pressure. Above that, the channel’s upper boundary near $2,110 becomes the first real test of strength.
For now, $1,970 is the line between Ethereum’s first green month in seven and a breakdown toward $1,650. It is that simple and that fragile.
The next few days will likely decide which story March tells when the candle finally closes.