
The crypto market caught a breath on Sunday. After a rough flush toward key support levels, total market cap climbed back above $2.25 trillion, and Bitcoin pulled the rest of the market along with it.
The bounce wasn’t massive. But the right assets moved in the right direction, and at least one altcoin made a seriously impressive jump. Here’s what happened and what traders are watching next.
Total Market Cap Climbs Back Above $2.25 Trillion
The total crypto market cap closed March 30 at $2.30 trillion, up 1.63% on the day. That recovery came after Sunday’s sharp dip toward the $2.25 trillion floor, which had traders watching nervously.
For now, demand appears to be stepping in at that level. Holding above $2.25 trillion opens the door to a push toward $2.32 trillion resistance. And if bulls can reclaim that level, the next target becomes $2.37 trillion.
But the setup isn’t bulletproof. A daily close below $2.25 trillion would weaken the recovery story quickly. A sustained break lower exposes the $2.19 trillion level, which sits as the lower boundary on most charts right now.
Bitcoin Trading at $67,216 in a Tight Decision Zone
Bitcoin rose 1.83% on the day, trading at $67,216. That sounds solid, but it’s sitting in a bit of an awkward spot, caught between the $65,887 support floor and the $68,830 resistance ceiling.
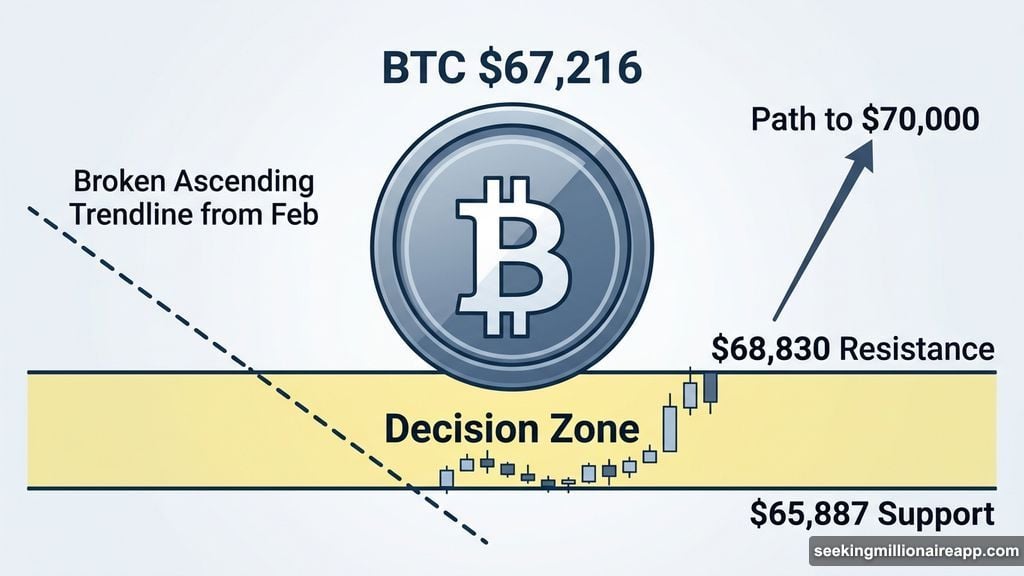
The asset broke below its ascending trendline from late February over the weekend. So this current bounce is more of a test than a confirmed reversal. Price has been grinding sideways between those two levels for several sessions now, compressing into what analysts call a decision zone.
The good news? The rising trendline is sitting near $67,000, which could act as dynamic support in the short term.
A daily close above $68,830 would shift momentum back toward bulls and open a path to $70,000. After that, $72,294 becomes the next structural target. On the flip side, a close below $65,887 would invalidate the recovery setup and bring $62,893 into focus as the next major support.
So how Bitcoin closes this candle matters a lot. It sets the tone for the coming week.
DeXe Surges 14% and Hits a Fibonacci Decision Point
The standout performer on March 30 was DeXe (DEXE), which jumped 14.06% to $8.169. That’s a strong single-day move, and it puts the governance token right at an interesting technical crossroads.
DEXE is now sitting at the 0.382 Fibonacci retracement level of $8.208. The daily candle is testing whether that level holds as new support after pushing up strongly from the $6.764 base.
If $8.208 holds, the next target is the 0.618 Fibonacci level at $9.100. Beyond that, the full 1.0 extension lands at $10.544, which would represent a complete retracement recovery.
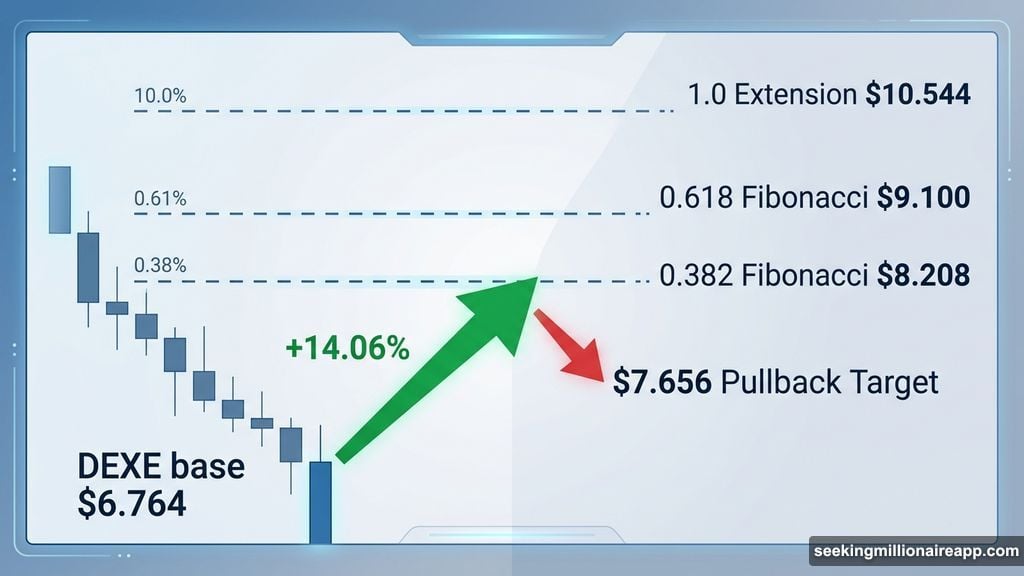
However, failing to hold $8.208 on a daily close sends DEXE back toward $7.656. And a breakdown below the $6.764 base would fully wipe out the current bullish structure.
Strategy May Have Paused Its Bitcoin Buying Streak
One story worth watching in the background involves Strategy and its long-running Bitcoin accumulation campaign. Executive Chair Michael Saylor skipped his usual Sunday “Orange Dot” social media post, which he typically uses to announce new purchases. Instead, he promoted the company’s preferred stock offering.
The signal is subtle but noticed. A Monday SEC 8-K filing will confirm whether Strategy actually paused its 13-week Bitcoin buying streak or quietly made a purchase without the usual announcement.
Iran’s Parliament Speaker Calls Trump’s Energy Posts a Reverse Indicator
In an unusual geopolitical side note, Iran’s Parliament Speaker Mohammad Bagher Ghalibaf posted on social media urging followers to trade against Donald Trump’s pre-market energy announcements. He called them a reliable “reverse indicator.”
The comment highlights a broader shift in market sentiment. Wall Street’s classic dip-buying instinct is fading as genuine geopolitical risk makes contrarian plays harder to call.
Right now, the crypto market is showing real signs of wanting to recover. Whether it follows through depends almost entirely on how Bitcoin closes the next few daily candles. Watch $68,830 on the upside and $65,887 on the downside. Those two levels will tell you everything.