The crypto market bled $5.39 billion on April 1. Total market cap dropped to $2.31 trillion, and the culprit isn’t coming from inside the blockchain.
It’s crude oil.
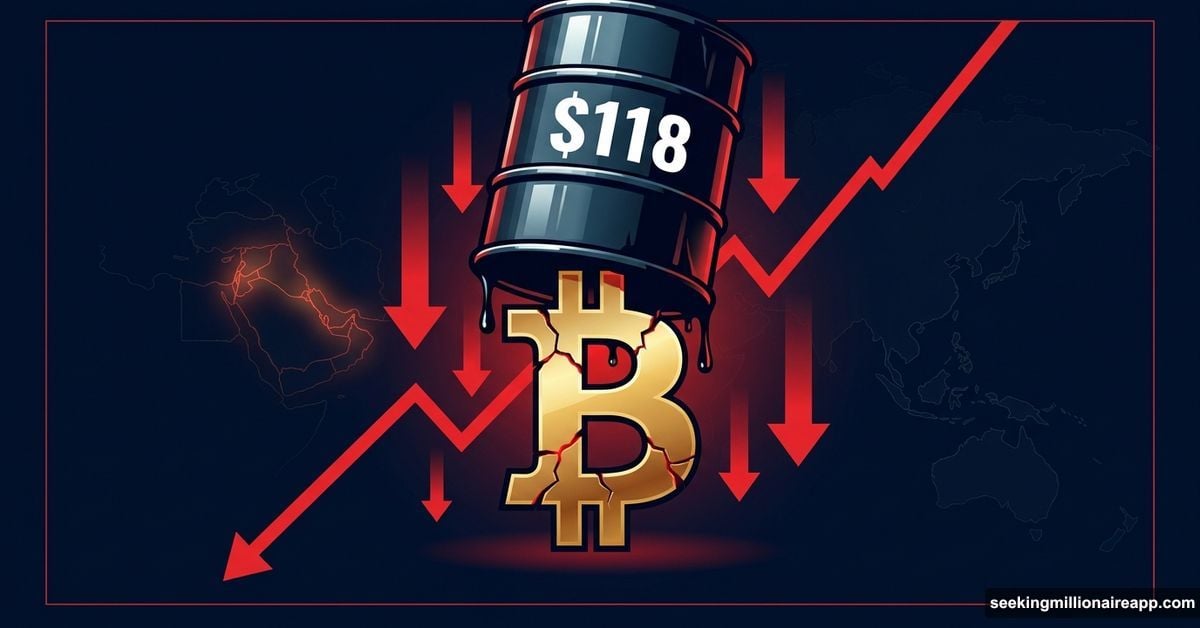
The Strait of Hormuz crisis has pushed Brent crude above $118 per barrel and gasoline past $4 per gallon nationally. That kind of inflationary pressure doesn’t stay in the energy sector. It spreads, squeezing risk appetite across every speculative asset class, crypto included.
Hormuz Shutdown Pins Total Market Cap Below Resistance
The total crypto market cap has been range-bound since late March. And the pattern makes sense once you understand what’s driving it.
When energy costs spike, portfolio managers get conservative fast. Capital rotates out of volatile assets and into safer positions. Crypto, sitting firmly in the “speculative” column, takes the hit.
President Trump has set an April 6 deadline for Iran to reopen the strait. But with no credible reopening plan in place, that deadline is adding uncertainty rather than relieving it. The market is watching and waiting.
![Wide-angle digital illustration showing global energy markets and cryptocurrency price charts side by side, with oil derricks and Bitcoin symbols under pressure from a red downward trend line]
Right now, $2.35 trillion is the resistance level the total market cap can’t break through. A clean close above it would be the first real signal that this range-bound pattern is ending. Beyond that, $2.55 trillion is the level where the structure turns genuinely bullish.
On the downside, $2.23 trillion has held as a floor through this correction. But a daily close below that level would expose $2.14 trillion. That’s the point where a contained dip becomes something more concerning.
Bitcoin’s Chaikin Money Flow Signals Institutional Retreat
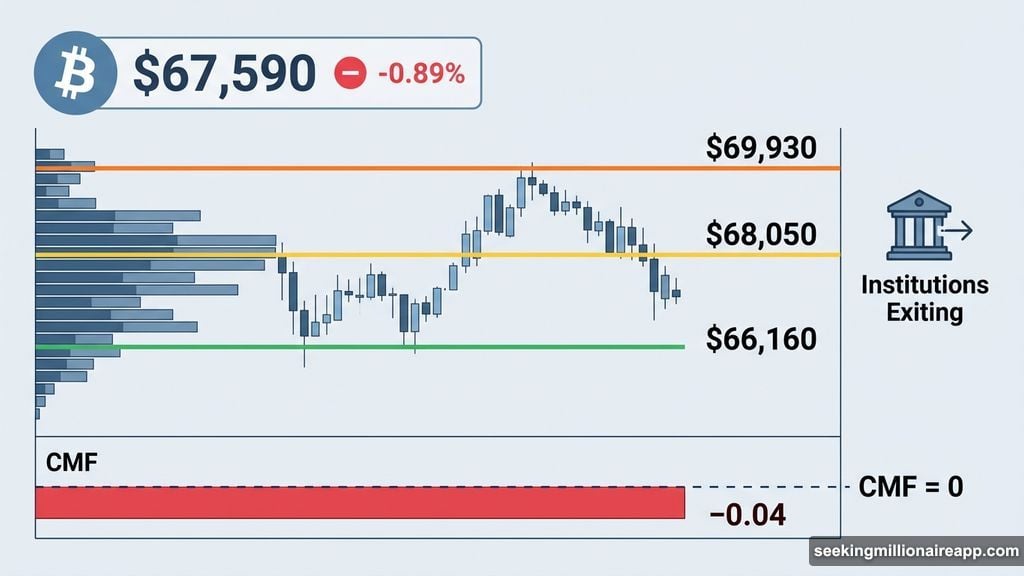
Bitcoin dropped 0.89% to $67,590, actually underperforming the broader market. With BTC holding 56.6% dominance, that matters more than it might seem. When Bitcoin drags, everything drags with it.
The Chaikin Money Flow (CMF) indicator tells the real story here. The CMF measures institutional capital movement in and out of an asset. On Bitcoin’s daily chart, it sat at -0.04 on April 1, stuck below the zero line.
That negative reading means institutions are flowing out, not in. And the timing lines up perfectly with the energy-driven risk-off environment. Rising oil prices are likely forcing portfolio managers to trim exposure to volatile assets, and Bitcoin is one of the first positions to go.
![Bitcoin price chart on TradingView showing CMF indicator below zero with key support and resistance levels marked at $66,160, $68,050, and $69,930]
So where does Bitcoin go from here? The most immediate support sits at $66,160. A break below that level could trigger a slide toward $63,470, with $60,050 waiting further down as the next meaningful floor.
On the upside, reclaiming $68,050 would be the first sign buyers are stepping back in. A daily close above that level targets $69,930. The picture is clear: $68,050 is the line between recovery and continued pressure.
Hyperliquid’s Bearish RSI Divergence Threatens Bullish Channel
Hyperliquid (HYPE) had a rough day, falling 3.3% to $36.23. Over seven days, the drop reaches 10%. The token still holds a 12% monthly gain, but that cushion is shrinking fast.
HYPE is a high-beta perpetual futures Layer 1 token. That means it’s more sensitive to risk sentiment shifts than large-cap defensive assets. When the broader market gets nervous, tokens like HYPE feel it harder and faster.
But the more worrying signal is the Relative Strength Index (RSI) divergence showing up on the 12-hour chart. Between March 2 and March 31, price printed a higher high while RSI printed a lower high. That’s a classic bearish divergence pattern, a sign that upward momentum is fading even as price keeps grinding higher.
Plus, HYPE is now closing in on the lower trendline of the bullish channel that has defined its uptrend since late February. That combination of bearish divergence and trendline pressure is a serious warning sign.
The key level is $35.68. A drop below that flips the structure from bullish to neutral or bearish and opens a path toward $29.68. Conversely, reclaiming $39.87 would relieve the immediate pressure. Sustained strength above $46.64 would restore the bullish case entirely.
Quantum Threats and Fraud Charges Add Background Noise
Beyond the oil-driven macro pressure, two other stories circulated in today’s news that are worth keeping on your radar.
Caltech researchers revealed that a fault-tolerant quantum computer could run Shor’s algorithm with just 10,000 qubits, dramatically down from previous estimates of one million. That compresses the timeline for when quantum machines could theoretically threaten blockchain cryptography. Separately, Google Quantum AI mapped 6.7 million BTC sitting in addresses currently vulnerable to quantum attacks.
Neither development creates immediate danger. But they represent the kind of long-term structural risk the industry needs to take seriously.
Meanwhile, the U.S. Department of Justice charged 10 foreign nationals from four crypto firms with orchestrating fraud schemes to artificially inflate trading volume and prices. Three defendants, including two CEOs, were arrested and extradited from Singapore. Wash trading and volume manipulation remain persistent problems in crypto markets, and enforcement actions like this one send a clear signal that regulators are watching.
What to Watch Before April 6
The next few days are critical. Trump is set to address the nation on Wednesday, days before the April 6 Hormuz deadline. Markets will be listening closely for any signal that the strait might reopen.
If crude prices start falling, risk appetite could return quickly. That’s the scenario where Bitcoin reclaims $68,050 and HYPE clears $39.87. But if the deadline passes without resolution, expect continued pressure below $2.35 trillion total market cap.
For now, the crypto market’s short-term fate is tied to an oil chokepoint in the Middle East. That’s an uncomfortable position for an asset class that prides itself on being decentralized and independent. Watch the energy headlines as closely as the crypto charts this week.