
The crypto market took a quiet hit today. Total market cap dipped to $2.28 trillion on April 3, briefly touching $2.27 trillion before buyers stepped back in to stabilize things.
Bitcoin led the weakness, dropping 0.55% to $66,581. That’s enough to drag broader sentiment lower when BTC carries 56% market dominance. Meanwhile, Ethena kept sliding, falling another 4.9% in 24 hours as its month-long sell-off deepens.
Here’s what’s pulling markets down right now — and where the key levels sit.
Oil Prices Keep Inflation Fears Alive
Risk assets can’t catch a break while oil keeps climbing. Brent crude gained roughly 8% over the past week and is pushing toward $110. That matters because rising oil keeps inflation expectations elevated, which limits how much upside assets like crypto can realistically achieve.
The S&P 500 did manage a green close on April 2 despite earlier shakiness. That helped put a short floor under crypto. But the bigger macro picture remains unfriendly to rate-sensitive markets, and crypto sits squarely in that category.
So until oil cools off or rate cut expectations firm up, crypto is fighting uphill.
Drift Protocol Exploit Now Hits 20 Solana Projects
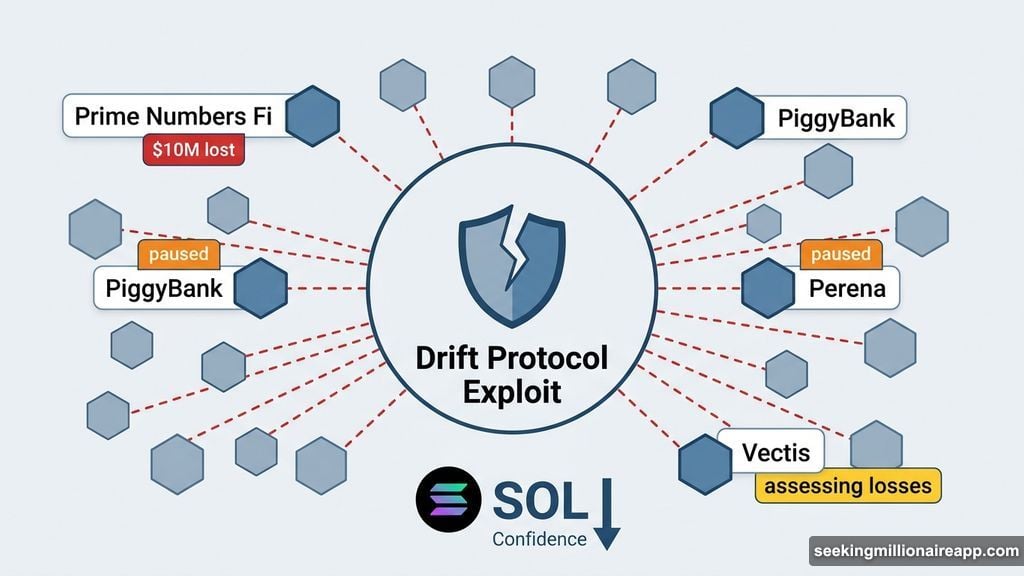
The Drift Protocol exploit story keeps getting worse. The number of affected Solana-based protocols jumped from 11 to 20, and the damage is still being counted.
Prime Numbers Fi alone lost an estimated $10 million. Other protocols including PiggyBank, Perena, and Vectis either paused operations or started assessing their own losses. That’s a significant wave of disruption rippling through the Solana ecosystem in a short window.
Exploits like this tend to dent confidence in DeFi broadly, even when the root cause is isolated. So the Drift fallout is adding quiet pressure on top of the macro headwinds already weighing on prices.
Bitcoin Smart Money Index Sends a Warning
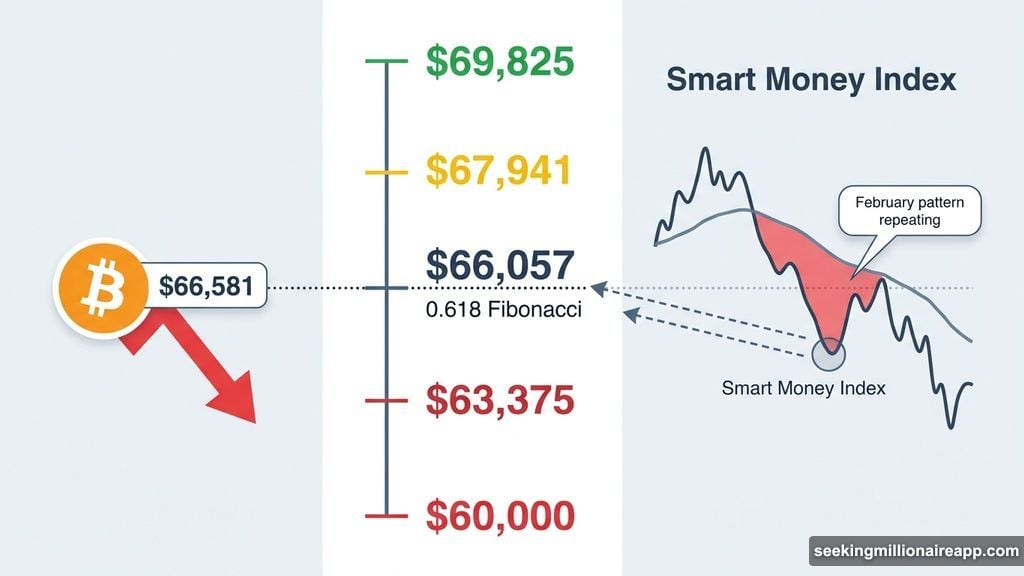
Bitcoin sits right at a critical technical floor. The $66,057 level — the 0.618 Fibonacci retracement — has held as support throughout March. Today’s drop brought BTC within striking distance of that line.
What’s worrying is the Smart Money Index (SMI), which tracks behavior from informed market participants. Right now, the SMI is trending below its signal line and diverging lower. A near-identical divergence showed up in early February, right before Bitcoin corrected about 8%.
![Bitcoin price chart showing Smart Money Index divergence near the $66,057 Fibonacci support level on April 3, 2026]
That doesn’t guarantee history repeats. But it’s a pattern worth watching closely. Bitcoin is still holding above its February 6 lows, which means the longer-term floor remains intact for now.
A daily close above $67,941 would ease the pressure and open the door toward $69,825. But a close below $66,057 points the way to $63,375 — and potentially $60,000 after that.
Ethena’s 34% Slide Forms a Bear Flag Pattern
Ethena has had a rough few weeks. The token has dropped 34% since March 16, falling to $0.0813 as of today’s 4.9% decline. And it’s not a dramatic crash story — it’s been a steady, grinding sell-off, which often signals deeper structural weakness rather than a one-time shock.
The fundamentals back that up. Ethena’s gross revenue dropped 32% quarter-over-quarter to $65 million in Q1 2026, and total value locked has been shrinking since early March. That’s a meaningful pullback in protocol health metrics.
![Ethena ENA price chart showing bear flag formation with RSI bullish divergence between February and April 2026]
The price structure since March 16 is starting to look like a bear flag — a continuation pattern that typically breaks downward. Any short-term bounce while inside that channel doesn’t break the pattern until ENA clears the upper trendline.
There is one encouraging signal, though. The RSI is showing a bullish divergence. Between February 24 and April 2, price made a lower low while RSI made a higher low. That kind of divergence often shows up before a price rebound.
If a bounce follows, the first resistance sits at $0.088, then $0.099 and $0.104. A sustained move above $0.099 would be the first real sign that buyers are taking control again. But a break below $0.078 would wipe out the bullish case entirely.
Crypto Industry News Worth Noting
Beyond the price action, a few business developments caught attention today.
Korea Investment Securities — one of South Korea’s largest brokerages — is in early discussions to acquire a stake in Coinone, the country’s third-ranked crypto exchange. This follows Mirae Asset’s Korbit deal and Binance’s Gopax approval, pointing to an ongoing wave of consolidation in Korea’s crypto market.
Coinbase also received conditional approval from the Office of the Comptroller of the Currency to charter Coinbase National Trust Company. That gives Coinbase a federal regulatory home for its custody and market infrastructure operations — a meaningful step toward mainstream legitimacy for the exchange.
Where Things Stand
The $2.27 trillion floor in total market cap is the number to watch right now. If it holds, a recovery toward $2.33 trillion — the 0.236 Fibonacci level — becomes plausible. If it breaks on a daily close, $2.23 trillion is the next technical support.
Today’s session is a case study in how multiple pressures stack up quietly. Rising oil, a widening exploit, bearish technical signals on Bitcoin, and deteriorating Ethena metrics don’t individually cause a crash. Together, though, they make it hard for buyers to build conviction.
The next 48 hours of price action around Bitcoin’s $66,057 floor will tell a lot about where this market heads next.