Bitcoin nearly broke free in April 2026. Then its own holders got in the way.
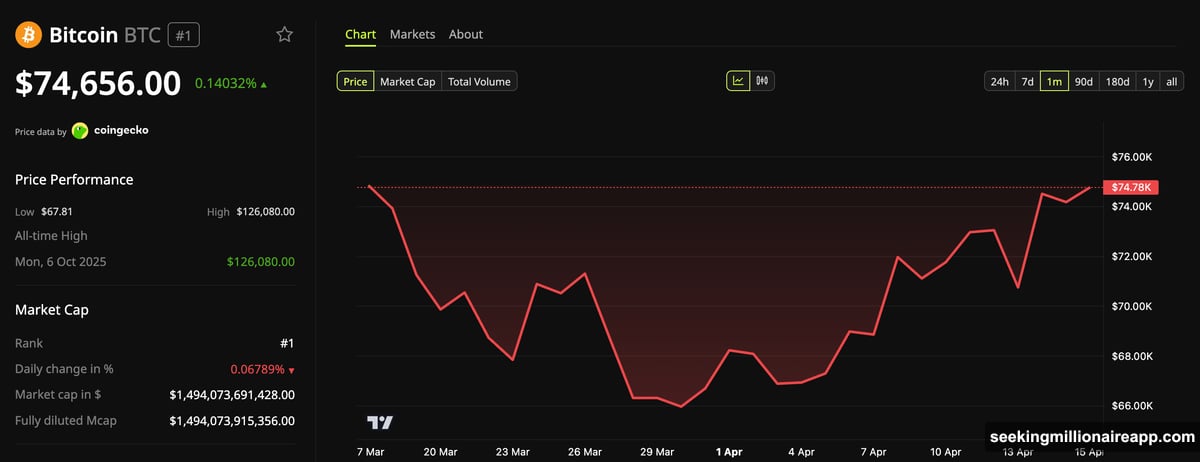
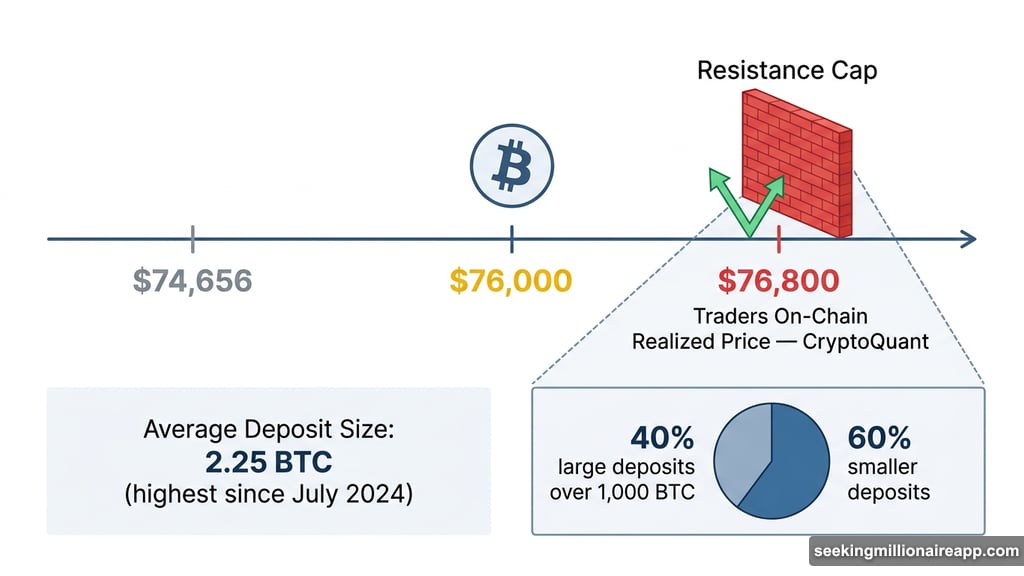
On April 14, BTC briefly climbed above $76,000 for the first time since early February. Realized profits hit $1.14 billion in a single day — one of the largest daily readings all year. But the gains didn’t stick. By press time, Bitcoin had pulled back to $74,656. And on-chain data points to one clear culprit: short-term holders cashing out at every opportunity.
Short-Term Holders Are Flooding Exchanges With Bitcoin
When Bitcoin tested $75,000 on April 15, something predictable happened. Short-term holders (STHs) rushed to the exits.
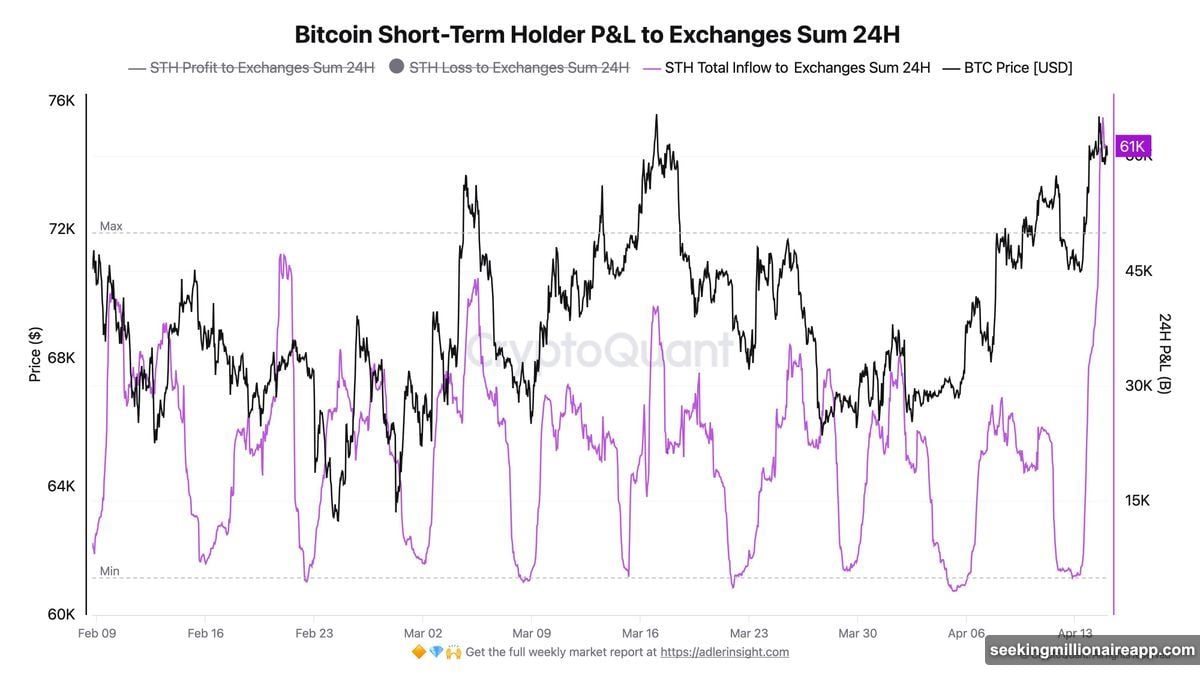
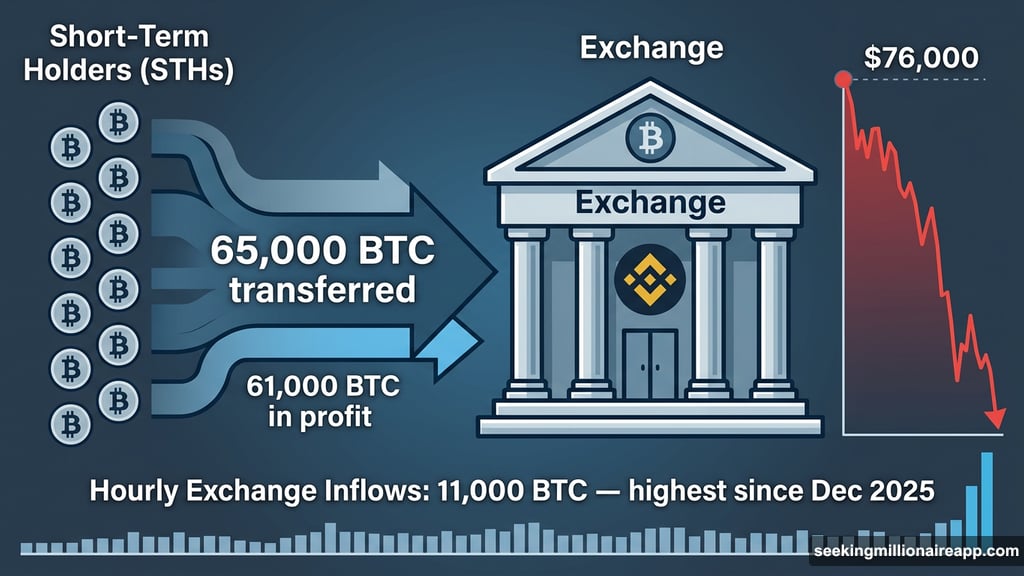
Within 24 hours, more than 65,000 BTC moved to exchanges. Of that, 61,000 BTC arrived in profit. Analyst Darkfost summed it up bluntly: “For now, any price increase is being treated as an opportunity to exit the market, whether in profit or at a loss.”
That’s a significant behavioral shift. Short-term holders aren’t holding through resistance. They’re treating every rally like a final sale.
The $76,800 Resistance Level Keeping BTC Trapped
On-chain analytics firm CryptoQuant flagged a specific price level worth watching: $76,800. That’s the Traders’ On-Chain Realized Price — essentially the average cost basis for short-term traders in the market right now.
Historically, this metric has capped relief rallies. It did exactly that during the January 2026 bounce. And it’s doing it again now.
As Bitcoin tested $76,000 earlier this week, hourly exchange inflows spiked to roughly 11,000 BTC. That’s the highest reading since late December 2025. CryptoQuant calls this “a historically reliable warning signal of near-term selling pressure, as holders move coins to exchanges in preparation for potential distribution at key resistance zones.”
The size of individual deposits also jumped sharply. The average exchange deposit hit 2.25 BTC — the highest daily reading since July 2024. Large transfers exceeding 1,000 BTC to Binance drove that spike. More telling: the share of large deposits as a percentage of total exchange inflows surged from below 10% to above 40% within just a few days around the $76,000 level.
Profit-Taking Hasn’t Peaked Yet
Here’s where things get interesting. Despite all this selling activity, daily realized profits are running around $500 million. That sounds large. But CryptoQuant notes it’s still below the $1 billion threshold that historically marks a significant profit realization spike in bear markets.
In other words, profit-taking hasn’t peaked. It’s building.
If Bitcoin holds near $76,000 or pushes higher toward the $76,800 Traders’ Realized Price, CryptoQuant warns that realized profits could accelerate sharply. That would add even more near-term selling pressure to an already fragile rally.
Glassnode’s weekly report backs this up. The 30-day exponential moving average (EMA) of the Realized Profit/Loss Ratio sits at 1.16 right now. That reading confirms investors are broadly selling into strength rather than accumulating.
The $78,100 Line That Changes Everything
So what would it actually take to break this pattern? According to Glassnode, Bitcoin needs to reclaim $78,100 — a level they call the True Market Mean.
Getting there isn’t just about price. It requires the market to absorb the current wave of profit-taking on a sustained basis. That kind of absorption demands a significant catalyst. Right now, with short-term holders treating every rally as an exit opportunity and institutional participation still rebuilding, that catalyst isn’t clearly visible.
The supply overhang is real. Until a meaningful portion of these coins find new hands willing to hold through resistance, Bitcoin faces a structural ceiling that price alone can’t break.
What This Actually Means for Bitcoin’s Next Move
Short-term holder behavior isn’t unusual after a volatile period. People buy during panic, survive the dip, and sell the first meaningful recovery. That’s human nature. But the scale here — 65,000 BTC hitting exchanges in 24 hours — shows just how many coins changed hands during Bitcoin’s recent lows.
The positive side of this? Selling pressure from short-term holders eventually exhausts itself. Once the bulk of these coins rotate to longer-term holders or new buyers willing to hold higher, the supply overhang clears. Past cycles show this process can take weeks rather than months when a genuine catalyst arrives.
For now, the clearest signal remains: watch $76,800 and $78,100. Those aren’t just numbers on a chart. They represent the psychological and realized cost basis of the people most likely to sell. A clean break above both levels, on real volume, would tell a very different story than what we’re seeing today.