Bitcoin is sitting at a crossroads right now. Price trades near $75,000, still licking its wounds after a sharp rejection at $78,380 on April 17. But underneath the surface, something interesting is happening.
Long-term holders are buying more aggressively than before. Derivatives leverage has been wiped clean. And a classic bull flag pattern is sitting on the chart, waiting for one key price level to break.
Here’s what the data actually shows.
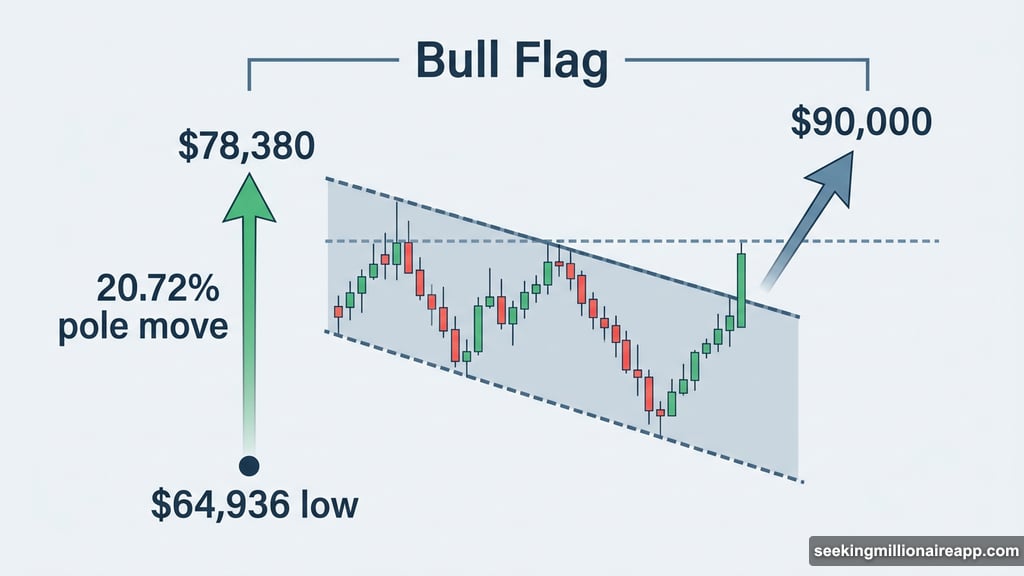
A 21% Pole Move Built This Bull Flag
Bitcoin surged 20.72% from its March 29 low to the April 17 peak at $78,380. That’s a 13,444-point move in roughly three weeks, and it created what chart analysts call the “pole” of a bull flag.
Since that peak, price has drifted into a descending parallel channel. That’s the flag portion. And bull flags historically signal continuation after sharp advances, not reversals.
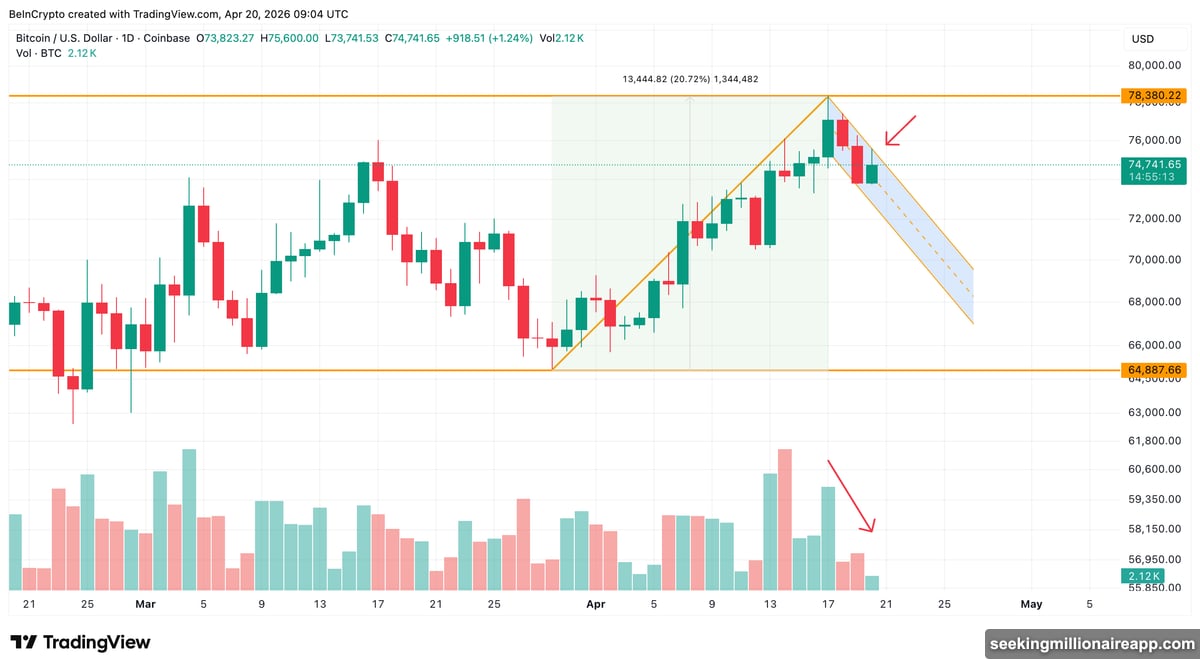
The flag’s upper trendline got tested twice. Once on April 18, and again on April 20. Both attempts printed long upper wicks on the candle charts, meaning buyers pushed into resistance but sellers pushed right back before the session closed.
Volume inside the flag tells a mixed story. Sell sessions have been outweighing buy sessions in volume terms. That’s not catastrophic for a flag, but it’s not the clean bullish setup traders prefer.
The pattern is still intact. The conviction isn’t there yet.
Open Interest Drops 10%, Funding Resets to Zero
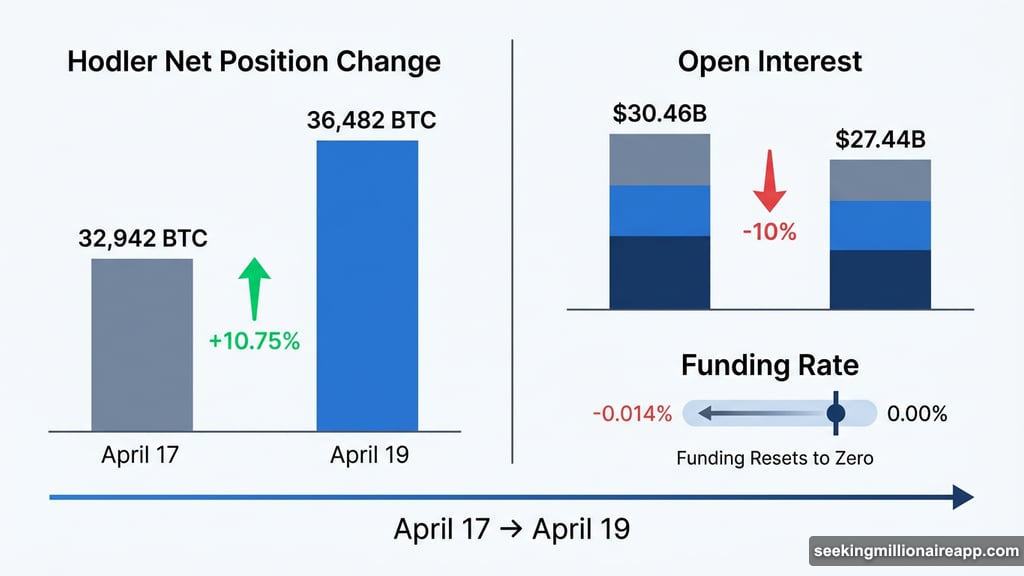
Since the April 17 rejection, Bitcoin’s open interest, the total dollar value of outstanding perpetual futures positions, fell from $30.46 billion down to $27.44 billion. That’s roughly a 10% reduction across three trading sessions.
Funding rates shifted too. The rate moved from -0.014% on April 17 to nearly -0.002% today. Negative funding means shorts pay longs. The move toward zero suggests short positions have been closing out, not piling in.
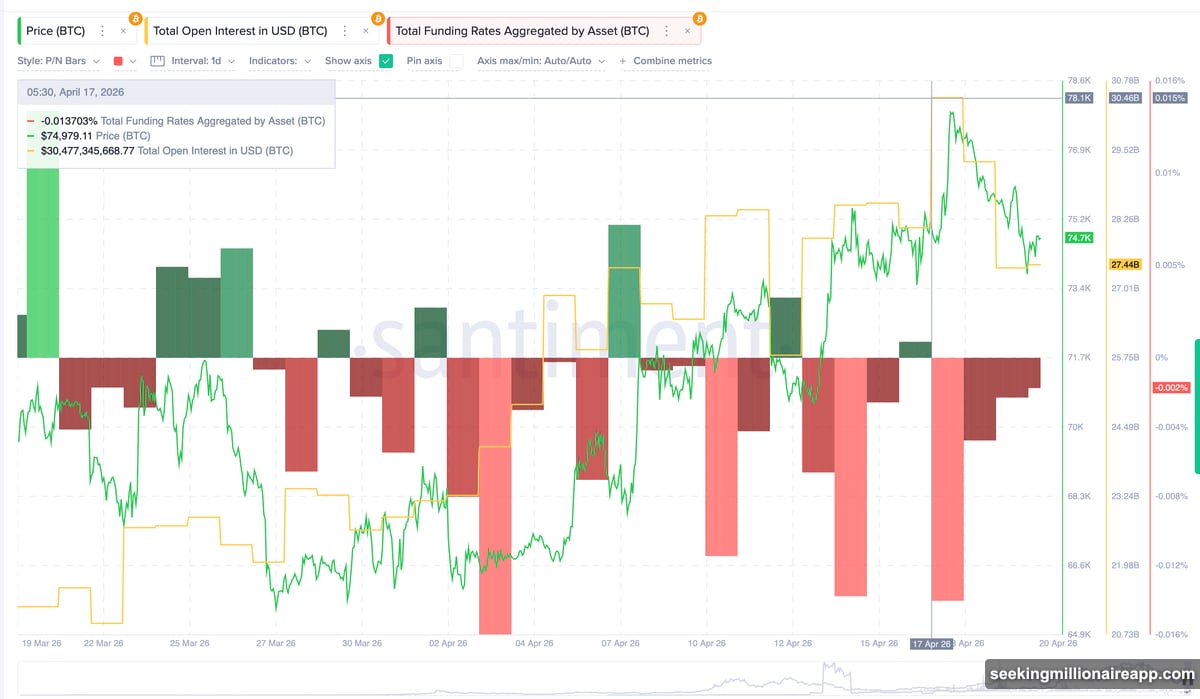
So the derivatives market isn’t voting bullish or bearish right now. It’s simply resetting.
The ideal contrarian setup would pair rising open interest with deeply negative funding, which signals a crowd of shorts building into a rally. Instead, open interest is shrinking while funding normalizes. New longs aren’t replacing the exiting shorts.
Clean derivatives positioning can sometimes precede a strong, sustainable move. But a reset alone doesn’t supply the demand a breakout needs. For that answer, you have to look at spot holders.
Long-Term Holder Accumulation Jumped Over 10%
This is where things get genuinely interesting.
The Hodler Net Position Change metric from Glassnode measures daily accumulation by long-term Bitcoin holders. Between April 17 and April 19, that figure climbed from 32,942 BTC to 36,482 BTC. That’s a 10.75% jump in just three sessions.
So while derivatives traders sit on the sidelines, long-term holders are buying the dip at an accelerating pace.
Who’s selling to them? The HODL Waves data from Glassnode answers that. The 1-week to 1-month cohort, which captures the most recent speculative buyers, peaked near 4% of circulating supply around April 9. By April 19, that figure had dropped to 2.781%.
That cohort compressed by roughly 30% in ten days. Short-term traders who bought the rally are taking profits. Long-term holders are absorbing that supply quietly, right inside the flag consolidation.
This rotation from weak to strong hands is one of the healthier signs you can see during a consolidation. It suggests the dip is being bought by people with patience and conviction, not momentum chasers.
The $75,190 Level That Opens the $90,000 Path
All of this analysis funnels down to a single price level: $75,190.98.
That’s the 0.236 Fibonacci retracement level, drawn from the $64,869 pole base to the $78,380 peak. Price tested this level on April 20 and got rejected. That rejection is what’s keeping the flag’s resistance cluster intact.
A daily close above $75,190 would break the flag to the upside. The pole projection, extending the full 20.72% pole move from the breakout point, targets $90,841.57. That’s roughly a 21% advance from current levels if the breakout confirms with volume.
Today’s green candle has formed without a corresponding buildup in derivatives leverage. That’s actually a good sign. It means any upward move isn’t immediately vulnerable to a long squeeze if sentiment shifts.
But two failed ceiling probes deserve respect. A deeper retest toward the 0.382 level at $73,218, or even the 0.5 level at $71,624, could set up a cleaner second attempt at the breakout. The level to watch on the downside is the 0.618 Fibonacci at $70,030. A daily close below that would mostly invalidate the bullish pattern.
For now, everything hinges on $75,190. Above it, the $90,000 target comes into play. Below $70,030, the bull flag thesis needs a serious rethink.
The hodlers are doing their part. The question is whether price can hold long enough for momentum to catch up.