
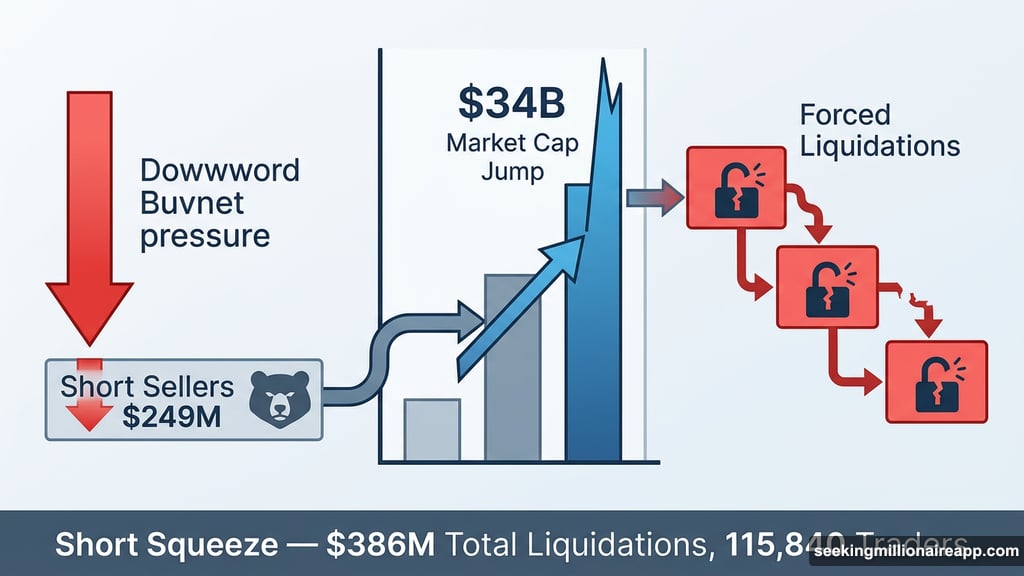
The crypto market just had a very good day. Total market capitalization climbed $34 billion in 24 hours, pushing the global crypto cap back above $2.57 trillion. And a big chunk of that move came at the expense of bearish traders who bet wrong.
Short sellers absorbed $249 million in forced liquidations as the market held firm. Meanwhile, Bitcoin clawed back toward $77,500, Monero posted a standout 12% weekly rally, and geopolitical tension continued to push capital away from traditional markets. Here’s what actually drove today’s move.
Geopolitical Tension Sent Capital Rotating Into Crypto
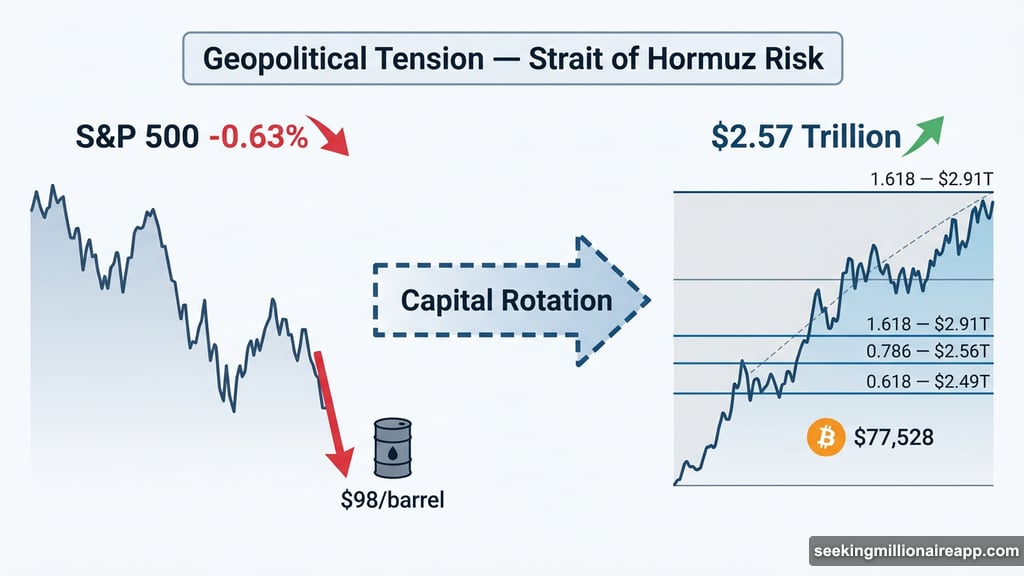
US equities didn’t have a great day. The S&P 500 closed down 0.63% at 7,064.01 on April 21, pressured by concerns over the US-Iran ceasefire extension and a paused diplomatic trip by Vice President JD Vance.
Oil held near $98 a barrel on fears of Strait of Hormuz disruption. That kind of geopolitical uncertainty tends to make traditional investors nervous. So some of that risk capital rotated toward digital assets instead, helping spark today’s crypto rebound.
It’s worth noting: this isn’t crypto going up because everything is going up. It’s crypto going up while equities go down. That’s a different dynamic, and it matters.
Short Sellers Turned Today’s Bounce Into a Squeeze
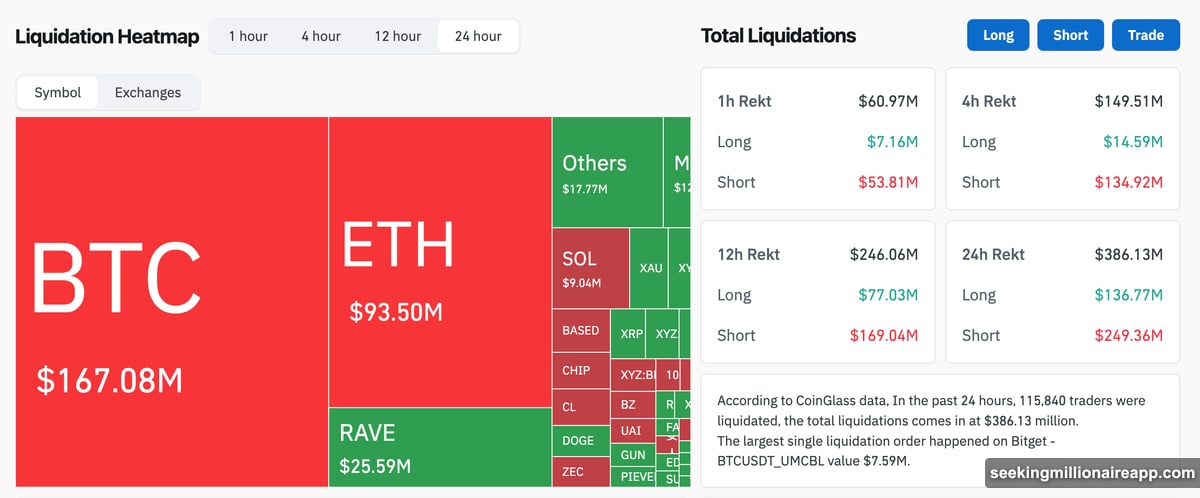
Here’s where things get interesting. The crypto market didn’t just drift higher. Short sellers accelerated the move by getting liquidated in bulk.
Over the past 24 hours, total crypto liquidations hit $386.13 million across 115,840 traders, according to CoinGlass. Short positions made up $249.36 million of that total, roughly 65% of all forced closures. Bitcoin alone accounted for $167.08 million in liquidations, with Ethereum close behind at $93.50 million.
What does that mean in plain terms? Bearish traders positioned for further downside got caught flat-footed when crypto held firm. Their forced buying pushed prices even higher. So the bounce that started from capital rotation got amplified into something bigger. That’s a classic short squeeze pattern, and it’s a key reason today’s move felt so sharp.
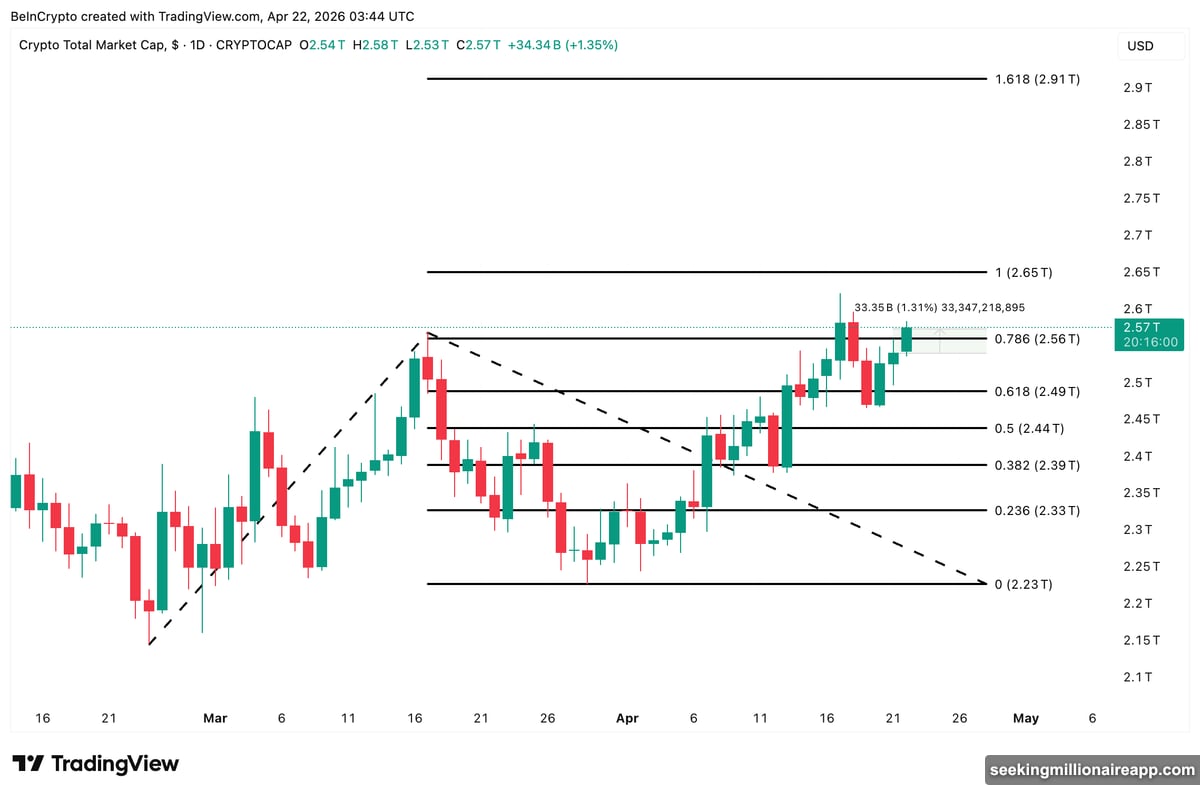
Total Crypto Market Cap Reclaims Key Fibonacci Level
The $2.56 trillion level wasn’t just a round number. It represented the 0.786 Fibonacci retracement level, a technically significant ceiling that had rejected previous recovery attempts earlier this week.
Reclaiming that level today is meaningful. A daily close above $2.56 trillion firms up that reclaim and opens the path toward $2.65 trillion next. Beyond that, the 1.618 Fibonacci extension sits at $2.91 trillion as the following structural target.
On the downside, the 0.618 golden zone at $2.49 trillion remains the critical support level for this current leg higher. A rejection at $2.56 trillion would likely send the market back to test that floor.
Bitcoin Price Analysis: $80,000 Back in Sight
Bitcoin traded at $77,528 as of this writing, up 2.5% over the past 24 hours. The daily chart shows BTC has been moving inside an ascending channel since March 4, with the lower trendline successfully defended at the March 29 low.
The next decisive level on the upside sits at $78,887. A daily close above that figure would put Bitcoin squarely on a path toward $80,486, the 0.5 Fibonacci level. That’s the clearest route back to the $80,000 psychological marker traders have been watching.
Push past $82,084 at the 0.618 level, and Bitcoin would align with the upper trendline of the ascending channel. That opens $84,359 as the next target. On the downside, $76,910 acts as the first support floor, followed by $73,713. A clean break below $73,713 would shift the trend bias decisively bearish.
Monero Outperforms the Privacy Coin Sector
Among large-cap tokens, Monero (XMR) stands out as the week’s most compelling technical setup. XMR gained 12% over the past seven days while the broader privacy coin sector advanced just 4.4%. That gap in performance is worth paying attention to.
The technical picture looks constructive. A volume spike on April 21 marked the right rim of what appears to be a cup formation, with price hitting a local high near $390. The market is now shaping what could become the handle portion of a classic cup-and-handle pattern.
The handle still needs to go deeper to confirm the formation. But if XMR posts a daily close above $394, that would signal a breakout. The measured move from the cup projects toward $443.87 at the 1.618 Fibonacci extension. A more aggressive cup projection puts the potential target at $480.57, representing a 23% move from current levels.
The bullish structure holds as long as XMR stays above $344.19. A break below $313.39 would invalidate the pattern entirely.
Strategy Overtakes BlackRock as the World’s Largest Bitcoin Holder
One more piece of news that didn’t get enough attention today. Strategy disclosed the purchase of 34,164 BTC for $2.54 billion between April 13 and April 19, bringing total holdings to 815,061 BTC.
That surpasses BlackRock’s iShares Bitcoin Trust (IBIT), which holds 802,824 BTC. Strategy is now the world’s largest corporate Bitcoin holder and the first corporate treasury to overtake a flagship Bitcoin ETF. That’s a remarkable milestone for a company that started buying Bitcoin as a treasury reserve just a few years ago.
What to Watch Next
Today’s move has clear catalysts. Geopolitical pressure on equities, short liquidations amplifying the bounce, and a successful reclaim of the $2.56 trillion Fibonacci level all contributed.
Whether this holds comes down to whether the market can post a convincing daily close above key levels. Bitcoin needs to clear $78,887 with conviction. The total market cap needs to stay above $2.56 trillion. And broader geopolitical headlines around the US-Iran situation and oil prices will continue to influence sentiment.
Short-term, the technical picture looks constructive. But this market has faked out plenty of traders before. Watch the closes, not just the intraday prints. Those daily candles will tell you whether this bounce has real legs or just borrowed momentum from squeezed shorts.