For years, Bitcoin traders swore by a simple playbook. Halving happens. Bull run follows. Euphoric peak arrives. Brutal crash wipes out latecomers. Repeat every four years.
But the 2024-2028 cycle threw that script out the window almost immediately. Bitcoin hit a brand-new all-time high before the April 2024 halving — something that had never happened before. Spot Bitcoin ETFs flooded the market with institutional cash earlier than anyone expected. And by October 2025, BTC peaked near $126,200 before sliding roughly 52% into early 2026.
So is the famous four-year cycle dead, alive, or quietly changing shape? The honest answer is more interesting than a simple yes or no.
What the Bitcoin Four-Year Cycle Actually Means
The four-year cycle isn’t some mystical force. It’s built on a real, mechanical event: the Bitcoin halving.
Every 210,000 blocks — roughly every four years — the reward miners receive for validating transactions gets cut in half. After the April 2024 halving, that reward dropped from 6.25 BTC to 3.125 BTC per block. Less new supply hits the market. If demand holds steady or grows, prices tend to rise.
The historical pattern backs this up. Major Bitcoin peaks appeared in 2013, 2017, November 2021, and most recently October 2025. That’s a pretty consistent drumbeat. Fidelity Digital Assets calls this the latest point in the four-year cycle framework, and it’s hard to argue with the timing chart.
But here’s the catch: a pattern isn’t the same as a law. Each cycle played out under completely different market conditions. And 2024-2026 introduced forces that the old model simply wasn’t built for.
How Past Bitcoin Cycles Actually Played Out
Before judging the current cycle, it helps to understand what made each earlier one tick.
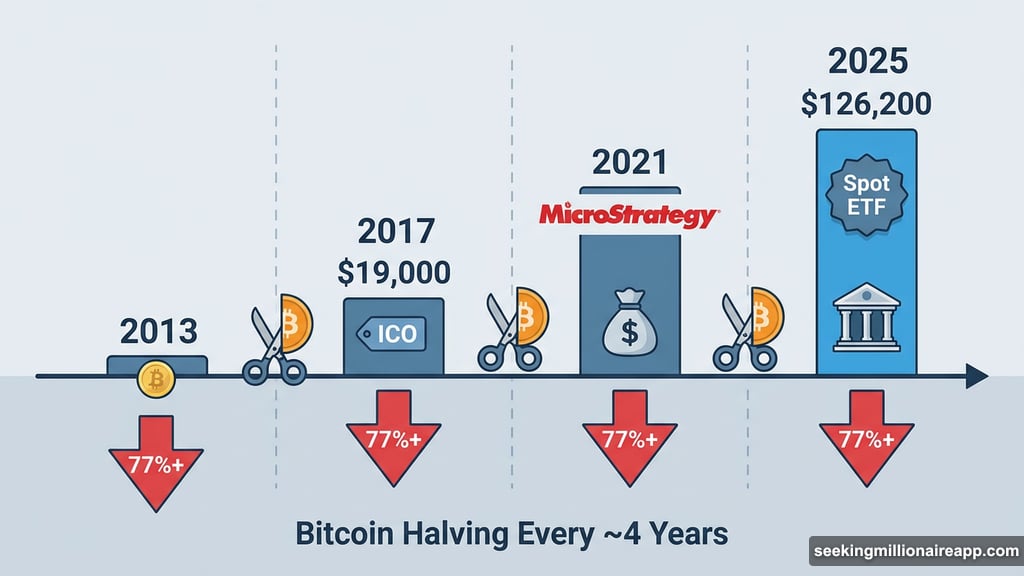
The 2012-2013 cycle was the wild west era. Small market, almost no infrastructure, early adopters swapping coins on sketchy exchanges. The 2016-2017 cycle brought retail mania and the initial coin offering (ICO) explosion, pushing BTC past $19,000 before a punishing multi-year crash.
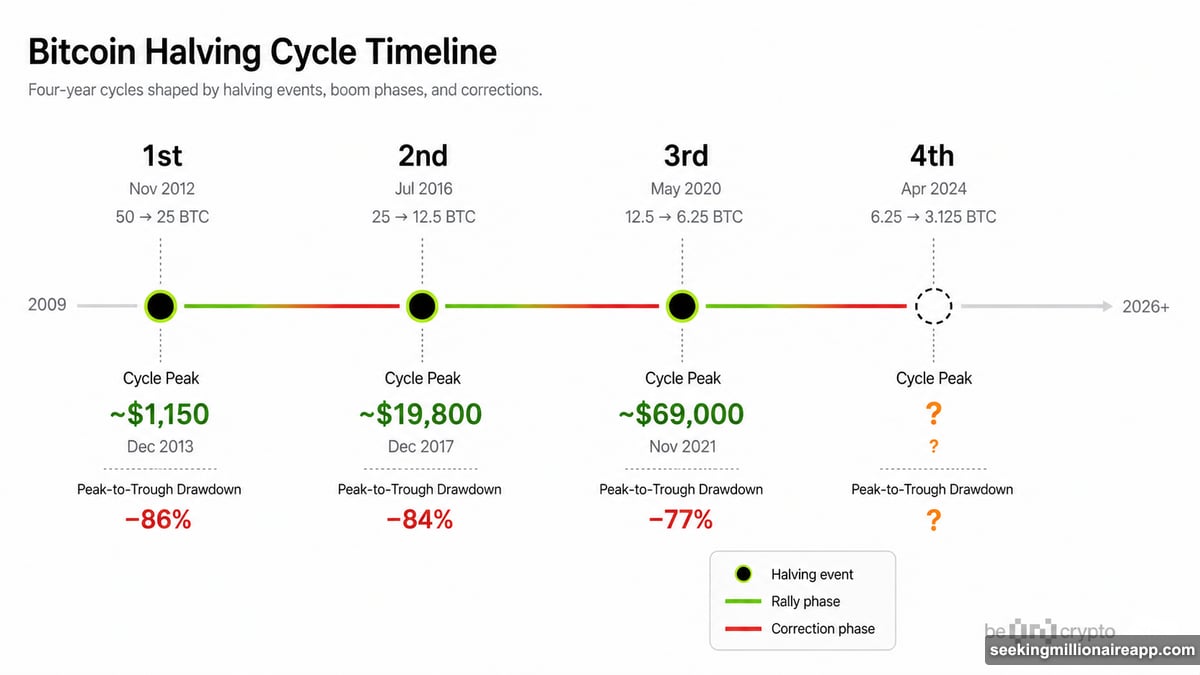
Then came 2020-2021, which had a completely different fuel source. Pandemic-era stimulus flooded financial markets with cheap money. Interest rates sat near zero. Public companies like MicroStrategy started loading BTC onto their balance sheets. The result was a massive bull run powered by liquidity rather than pure speculation.
One thing stayed consistent across all three cycles, though. According to Fidelity Digital Assets research, every prior Bitcoin bear market produced drawdowns of at least 77% from the peak. That’s an important number to keep in mind for 2026.
![Bitcoin four-year halving cycle chart comparing 2013, 2017, 2021, and 2025 peaks with ETF inflow data overlaid]
The 2024-2026 Cycle Already Broke a Big Rule
Here’s where things get genuinely interesting. Bitcoin reached a new all-time high in March 2024 — before the April 2024 halving even happened.
That had never occurred in any prior cycle. Every previous peak came at least 12 months after a halving, not before it. Grayscale noted that Bitcoin fully recovered from its 2021-2022 drawdown and set a record in early 2024, driven largely by ETF-related demand. That single data point is probably the strongest evidence that the cycle mechanics have genuinely shifted.
So what caused the early surge? One word: ETFs.
The SEC approved spot Bitcoin exchange-traded products (ETPs) on January 10, 2024. For the first time, U.S. investors gained regulated, direct access to Bitcoin exposure without holding the asset themselves. The demand response was immediate and massive.
According to CME Group data, net inflows into U.S.-listed spot Bitcoin ETFs averaged $208 million per day during February 2024. Meanwhile, new BTC issuance at that time ran at about 900 BTC daily — worth roughly $54 million at March 2024 prices. ETF demand was outpacing fresh supply by nearly four to one, months before the halving even compressed issuance further.
That’s the key mechanism. ETFs front-loaded institutional buying. They compressed the supply-demand gap that previously took many months to develop after each halving. The cycle didn’t disappear — it accelerated.
Bitcoin Volatility Hit Record Lows Near All-Time Highs
Here’s something that would have seemed impossible in earlier cycles. Fidelity Digital Assets found that 2025 was the least volatile year in Bitcoin’s entire history based on annualized realized volatility.
In January 2026, Fidelity recorded 17 new instances of all-time lows in one-year realized volatility — occurring just months after BTC reached record prices near $126,200. In previous bull markets, peaks came with explosive, chaotic price swings. Not this time.
Why the difference? Roughly 12% of Bitcoin’s circulating supply now sits in the hands of public companies and exchange-traded products, according to Fidelity. Long-term, less reactive holders don’t panic-sell like retail traders do. So the wild blow-off tops that characterized 2013, 2017, and 2021 simply didn’t materialize with the same intensity.
Furthermore, derivatives markets have grown dramatically more sophisticated. CME Group Bitcoin futures averaged $11 billion in daily open interest during March 2024. Kaiko’s 2026 outlook notes that derivatives now account for 73.2% of total crypto market volume. Regulated futures and options allow institutions to hedge, manage risk, and engage in price discovery in ways that dampen extreme one-directional moves.
The Early 2026 Drawdown: Old Pattern or New Reality?
After peaking near $126,200 on October 6, 2025, Bitcoin slid into a significant correction. By early 2026, BTC had fallen roughly 52% from that high, touching around $60,000 at its lowest point. The decline lasted 122 days.
Research firm NYDIG classified this as a cyclical top and argued the timing and depth of the drop were consistent with the historical four-year framework. Their MVRV (Market Value to Realized Value) analysis showed the ratio approaching levels historically associated with cycle bottoms — with a 1.0x MVRV corresponding to approximately $55,326 as of Q1 2026.
But here’s the contrast that matters. Prior Bitcoin bear markets fell at least 77% from peak prices. A 52% drop, while painful, is meaningfully shallower than anything in Bitcoin’s bear market history. Fidelity attributes this to lower volatility, greater institutional ownership, and a more mature market overall.
So the drop still happened — but it hit less hard than the old pattern would have predicted. That’s either evidence the cycle is evolving, or we haven’t seen the full correction yet. That debate is very much alive in 2026.
Institutions Changed Who Controls Bitcoin’s Price Discovery
In every prior cycle, retail enthusiasm drove the narrative. Crypto Twitter buzzed, YouTube influencers pumped projects, and ordinary people piled in at peak prices. Institutions mostly watched from the sidelines.
That dynamic has shifted substantially. Grayscale’s 2026 outlook reports that global crypto ETPs have seen $87 billion in net inflows since U.S. Bitcoin ETPs launched. Yet advised U.S. wealth still allocates less than 0.5% of assets to crypto. That gap represents enormous potential demand waiting to enter the market.
Coinbase’s 2026 outlook frames the current period as one of institutional integration and regulatory maturity rather than another retail boom-and-bust. Financial advisors, pension allocators, and corporate treasuries are now active participants rather than skeptical observers.
Also, Bitcoin increasingly moves alongside traditional risk assets during macro events. When global markets get nervous and investors shift toward safety, Bitcoin often sells off alongside stocks. That’s a meaningful change from earlier cycles when crypto markets moved more independently from traditional finance. Fidelity specifically identifies monetary policy as a key cycle factor in 2026 in ways that simply didn’t apply in 2013 or 2017.
Seven Signals That Matter More Than Halving Dates Now
The old approach was simple: mark the halving date on a calendar, buy a year before, sell a year after. That framework needs updating. These are the indicators worth watching closely in 2026.
ETF inflows and outflows move markets faster than anything else right now. As of the week ending April 20, 2026, CoinShares reported $1.2 billion in digital-asset inflows, extending a four-week streak. Sustained buying compresses available supply. Sharp outflows during risk-off periods can accelerate declines quickly.
MVRV ratio compares Bitcoin’s current price to the average cost basis of all BTC on the network. When MVRV falls below 1.0, most holders are sitting on losses — historically a reliable signal of capitulation and a potential price floor. NYDIG pegs the 1.0x MVRV level at roughly $55,326 as of Q1 2026.
Volatility trends tell you whether the market is maturing or reverting to its old chaotic behavior. Lower volatility near record highs suggests institutional ownership is dampening extreme swings. A sudden spike in volatility could signal a return to more emotionally driven price action.
Stablecoin dominance measures how much of the total crypto market cap sits in assets like USDT and USDC rather than active risk positions. Kaiko reported stablecoin dominance surged to about 10.3% during the early 2026 correction — exceeding levels seen after the FTX collapse in late 2022. Historically, peaks in stablecoin dominance have coincided with cycle bottoms. When that capital rotates back into Bitcoin and other assets, prices tend to recover.
Derivatives leverage through open interest, funding rates, and leverage ratios can separate genuine buying from borrowed speculation. When leverage gets extreme, small price moves trigger cascading liquidations. Kaiko’s data showing derivatives at 73.2% of total crypto volume means this signal is more important than ever.
Miner economics still matter after the April 2024 halving reduced daily new supply from 900 BTC to 450 BTC. When Bitcoin price falls below miner breakeven costs, miners often sell reserves to cover operating expenses, adding selling pressure at already vulnerable price levels. Hash rate trends and miner reserve data reveal whether miners are accumulating or distributing coins.
Long-term holder behavior tracks addresses that haven’t moved BTC in at least 155 days. When experienced holders start distributing during rallies, it often signals a cycle peak. When they accumulate during drawdowns, it suggests conviction buyers see value. The 12% of circulating supply now held in ETPs and public companies adds a new wrinkle here — that BTC behaves like long-term holdings even though the underlying fund investors might rotate at any time.
Three Ways to Think About the Cycle Right Now
Analysts and research firms don’t agree on what’s happening, and that disagreement is actually valuable information.
NYDIG sits in the “cycle intact” camp. Their data shows the October 2025 peak and early 2026 drawdown fitting the historical four-year timing closely enough to call it a continuation rather than a break. Their MVRV analysis supports the idea that a cycle bottom could be forming at levels consistent with prior recoveries.
Grayscale takes the opposite view. The firm expects the four-year cycle thesis to prove wrong this time. They see institutional integration and steadier capital inflows replacing the old boom-bust rhythm with something more like a traditional asset class cycle.
Fidelity’s own analysts are split internally. Some support a supercycle thesis. Others, including analyst Jurrien Timmer, argue the traditional pattern remains intact. That internal disagreement at one of the most respected research firms in the space is itself telling.
The most defensible position in 2026 is probably this: the halving still anchors supply changes, but it no longer explains the full picture by itself. ETF demand, institutional allocation, derivatives positioning, and global liquidity conditions now matter just as much. The cycle has evolved, not ended.
What This Means If You’re Watching Bitcoin in 2026
The practical takeaway isn’t complicated, but it does require updating old mental models.
The four-year cycle can still orient your thinking about broad timing and market psychology. The old peaks and troughs, the fear and greed dynamics, the post-halving supply squeeze — these things haven’t vanished. But using a halving calendar as a standalone investment strategy is too simple for where the market stands today.
Grayscale estimates that less than 0.5% of U.S. advised wealth currently sits in crypto as of early 2026. If that figure rises to even 1-2% as regulatory clarity improves and more wealth management platforms integrate crypto into standard portfolios, ETF-driven demand could structurally outweigh the supply impact of future halvings. The next halving, expected around April 2028, will drop the block reward to just 1.5625 BTC — a smaller supply shock into what will likely be an even larger institutional market.
The seven signals outlined above — ETF flows, MVRV, volatility, stablecoin liquidity, derivatives leverage, miner economics, and long-term holder behavior — will probably matter more with each passing cycle, not less. The halving still deserves attention as a supply anchor. But the market that responds to it looks less like 2017 every year, and more like a maturing financial asset finding its footing in traditional portfolios.
Watch the data. Stay skeptical of anyone who tells you the old cycle guarantees a specific outcome. And remember that the most important thing the four-year framework ever really taught was this: Bitcoin markets move in long, emotional waves shaped by supply, demand, and human psychology. That part hasn’t changed at all.