
Bitcoin just crashed. Again. And this time, the chart’s telling a story that’s hard to ignore.
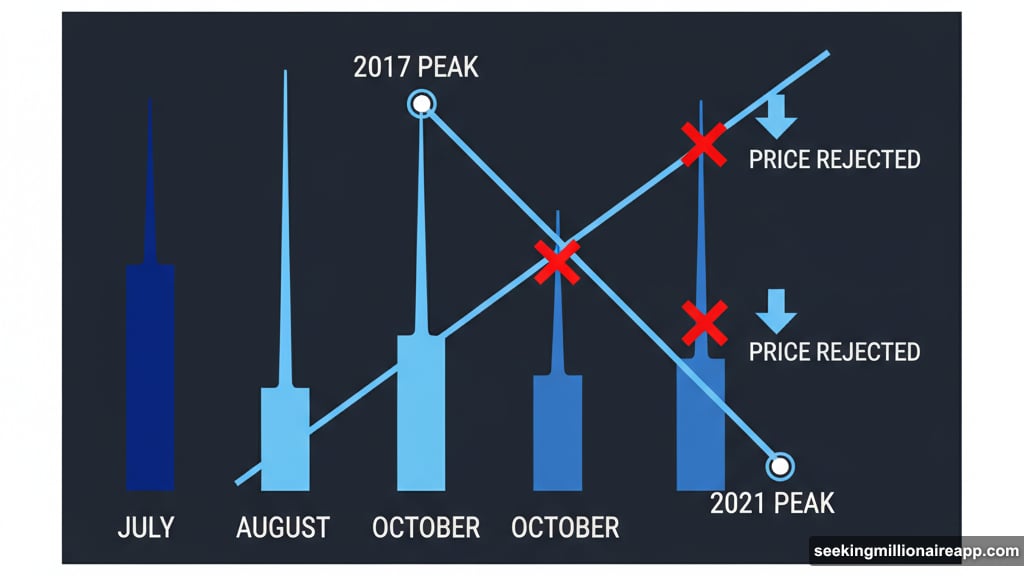
Friday’s plunge marks the third time bulls tried to break above a critical resistance line and failed. That trendline connects Bitcoin’s 2017 and 2021 peaks. Three failures at the same spot? That’s not coincidence anymore. That’s a pattern.
Now traders are watching to see if BTC drops all the way to $100,000 or lower. The technical signals point south.
Three Strikes at Resistance
Look at Bitcoin’s monthly chart. July, August, and now October all show the same thing: long wicks at the top of the candles.
Those wicks represent rejected rallies. Bitcoin pushed above that 2017-2021 trendline briefly, then got smacked back down. Each time, bulls couldn’t hold the gains.
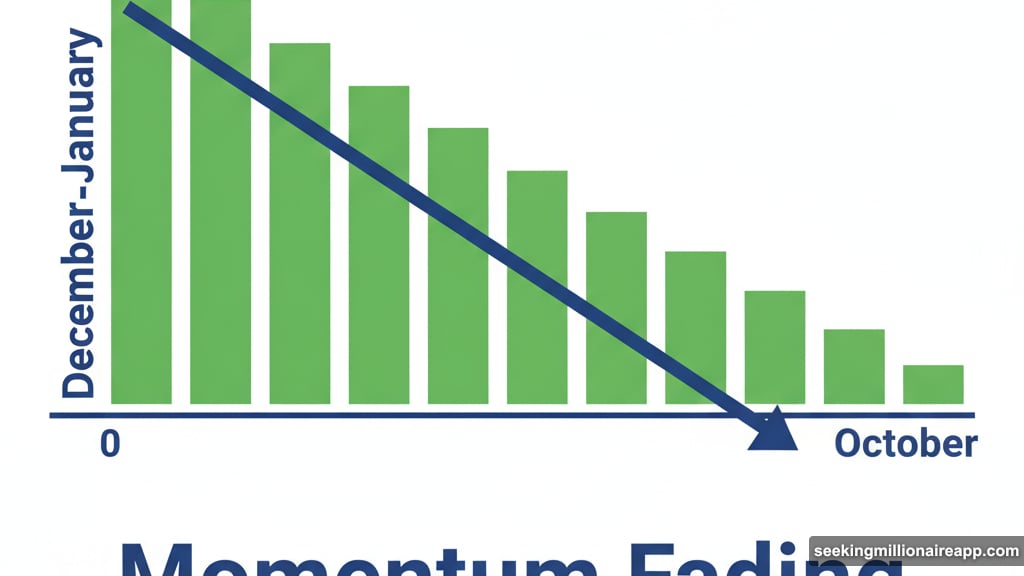
But here’s what makes this particularly concerning. The MACD histogram on the monthly chart is still positive, which normally signals bullish momentum. However, it’s weaker now than during December and January when Bitcoin first crossed $100,000.
So momentum is fading. Bulls are losing steam with each attempt to break higher.
What the Daily Chart Shows
Zoom into the daily timeframe and the picture gets worse for bulls.
Bitcoin reversed sharply from resistance on an expanding channel pattern. Meanwhile, both the standard MACD and the longer-duration version show negative readings.
That longer-duration MACD uses 50-day and 100-day moving averages. It filters out short-term noise better than standard settings. And right now, it’s clearly bearish.
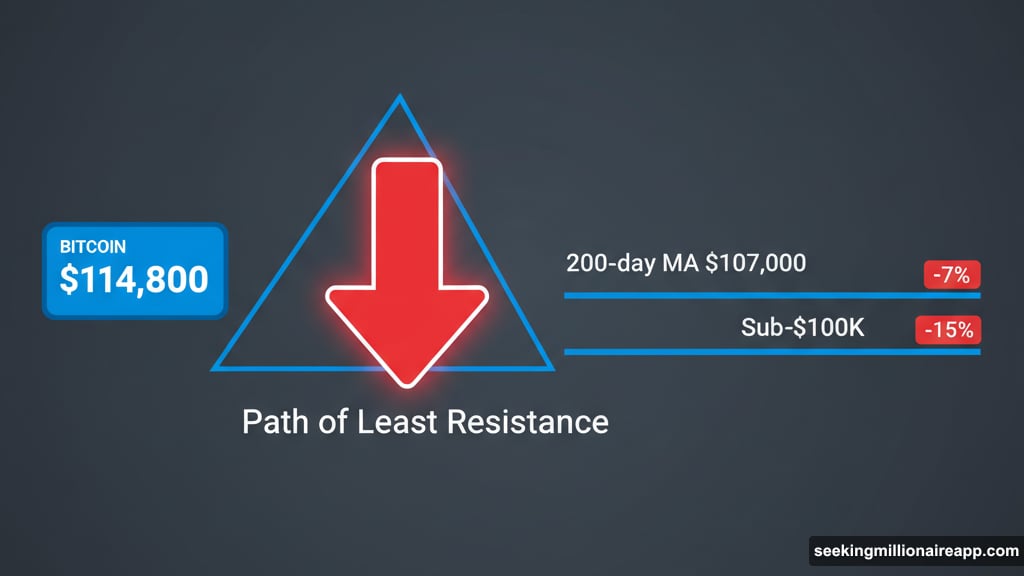
The path of least resistance? Downward.
Key Support Levels to Watch
If Bitcoin continues falling, where does it land?
First stop could be the 200-day simple moving average around $107,000. That’s a level traders watch religiously. Many will try to buy there.
But if that breaks, the lower end of the expanding triangle pattern comes into play. That puts us firmly below $100,000.
For context, Bitcoin traded around $114,800 at press time. So we’re talking about a potential 7-8% drop to test the 200-day MA, or closer to 15% to reach sub-$100K levels.
What Would Flip the Script
Bulls aren’t dead yet. They just need to do something they haven’t managed three times already: break and hold above that trendline.
Specifically, Bitcoin needs to clear $121,800 convincingly. That would create a higher high, breaking the current pattern of lower peaks. It would invalidate the bearish setup entirely.
But until that happens, sellers control the narrative. The chart doesn’t lie about that.
Trade War Jitters Made It Worse
Friday’s crash didn’t happen in a vacuum. Tensions between the U.S. and China over tariffs sent shockwaves through risk assets.
Bitcoin’s correlation with traditional markets showed up again. When stocks panic, crypto follows. Investors fled to safety, and Bitcoin isn’t considered safe during geopolitical uncertainty.
The crash triggered nearly $20 billion in liquidations across crypto markets. Leveraged positions got wiped out. That kind of forced selling accelerates price declines and creates cascading effects.
Some traders got hit by auto-deleveraging on perpetual futures platforms. Those are automated systems that close positions when the exchange can’t find enough counterparties. It’s brutal when it happens, even for experienced traders.
Mining Companies Keep Buying
Despite the crash, at least one major player sees opportunity.
Marathon Digital Holdings bought 400 BTC worth approximately $45.9 million during the price drop. On-chain data from Arkham shows the purchase went through their custodian, Anchorage Digital.
Mining companies typically accumulate Bitcoin when they believe prices will recover. Marathon’s purchase suggests they view this crash as a buying opportunity, not the start of a prolonged bear market.
Fresh inflows to FalconX hint at continued institutional accumulation too. So while retail traders panic-sold, institutions quietly stacked sats.
The Bigger Picture
Bitcoin’s struggle at this resistance level reveals something important about market psychology.
Every cycle has a ceiling where euphoria breaks. In 2017, it was $20,000. In 2021, it was $69,000. This cycle, that trendline connecting those peaks might represent a psychological barrier traders can’t overcome yet.
Technical resistance becomes self-fulfilling. Enough traders see the same pattern and make the same bets. Sellers line up at key levels because they expect others to sell there too.
Breaking through requires either massive new capital inflows or a fundamental shift in market sentiment. We haven’t seen either yet.
What Happens Next
Two scenarios play out from here.
Scenario one: Bitcoin drifts lower over coming weeks, testing support around $107,000 and potentially $100,000. Volatility stays elevated as traders watch for signals about trade tensions and broader economic conditions. This is the higher probability outcome based on current technicals.
Scenario two: Bitcoin finds strong support here, consolidates briefly, and makes another run at $121,800. This requires either a major catalyst or relentless institutional buying. Less likely in the short term, but not impossible.
Either way, the repeated failures at trendline resistance changed the game. Bulls need to prove they can break through. Until then, bears hold the advantage.
Watch those support levels. If the 200-day moving average breaks, the next stop is likely much lower. But if it holds and price bounces sharply, we might get that fourth attempt at resistance after all.
The chart is clear about one thing: Bitcoin’s at a critical juncture. The next few weeks will tell us whether this bull cycle has more room to run, or if we’re heading for an extended consolidation below $120,000.