
Bitcoin crashed to $89,190 yesterday. Then something interesting happened underneath.
While everyone panicked about the drop, two critical shifts occurred. Long-term holders started accumulating heavily. Meanwhile, short positions piled up near key resistance levels. Now Bitcoin trades around $90,800, roughly flat on the day but up 2.7% over seven days.
This isn’t about the dip. It’s about what formed during it.
Cup-and-Handle Pattern Holds Despite Volatility
Technical patterns matter when they survive stress tests. Bitcoin’s cup-and-handle structure just passed one.
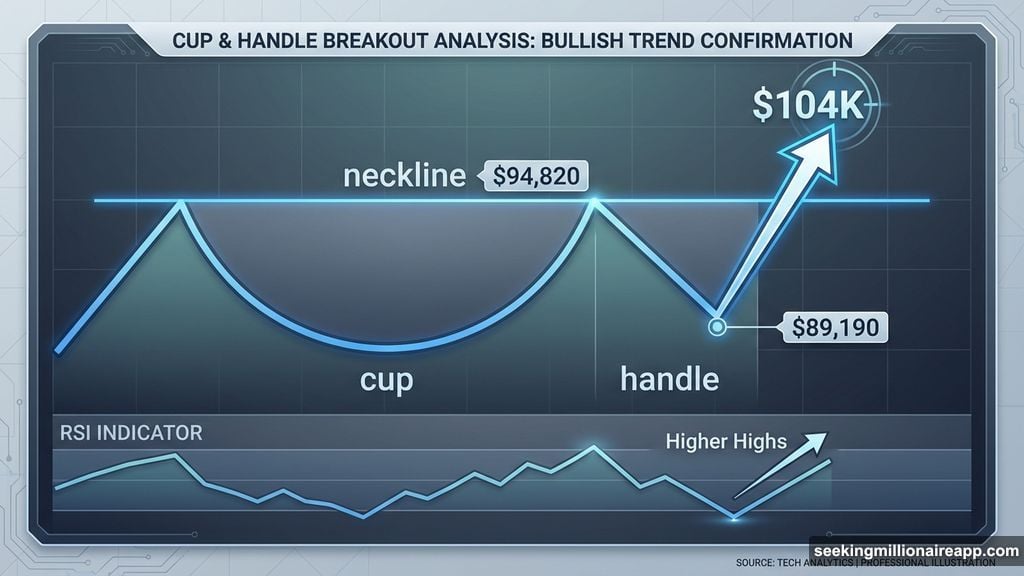
This pattern forms when price carves out a rounded bottom, consolidates through a shallow pullback, then breaks higher. The recent drop to $89,190 deepened the handle without destroying the overall formation. That’s actually constructive.
The Relative Strength Index confirms momentum alignment. Between December 9 and January 5, Bitcoin made a higher high. RSI printed a higher high too. That means momentum moves with price, not against it.
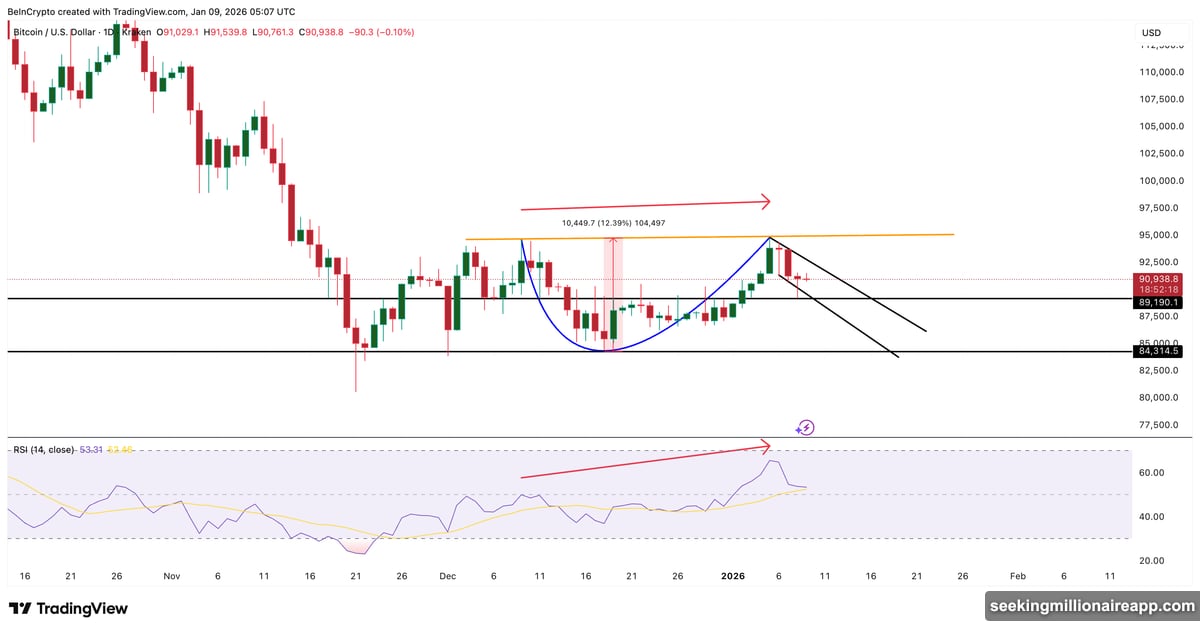
No bearish divergence appeared. That reduces near-term breakdown risk significantly.
However, two hurdles remain. Bitcoin must clear the handle’s upper boundary first. Then it needs to break the neckline. Until those levels fall, this stays a setup rather than confirmation.
Hodlers Added 2,400 BTC During Price Weakness
On-chain metrics reveal conviction shifts. Long-term holders didn’t sell into yesterday’s dip. They bought aggressively.
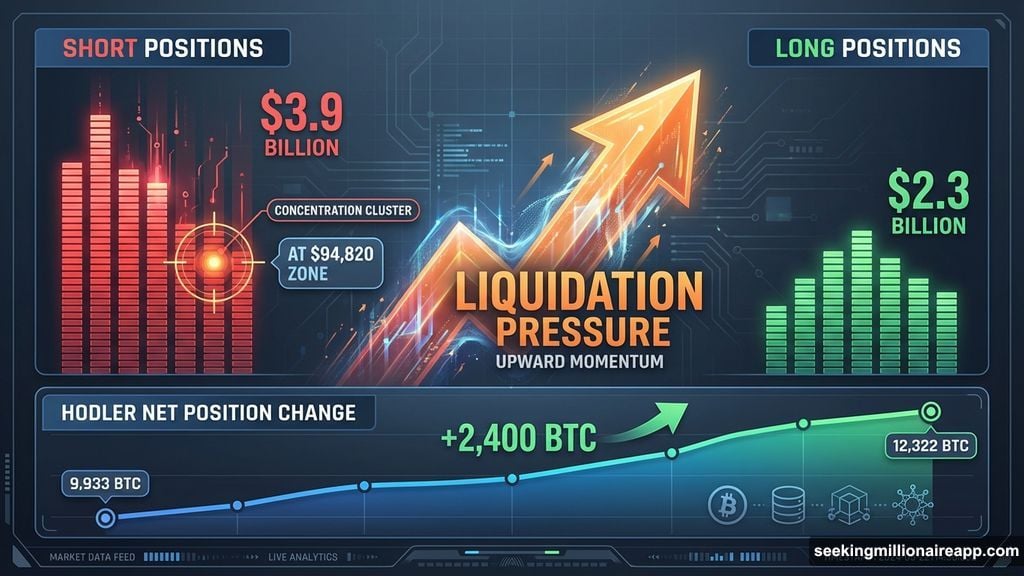
The Hodler Net Position Change tracks whether experienced holders accumulate or distribute Bitcoin. On January 6, when Bitcoin traded near $93,700, this metric stood at roughly 9,933 BTC. By January 8, amid the selloff, it jumped to about 12,322 BTC.
That’s nearly 2,400 BTC added in two days. A 24% increase in accumulation during price weakness.
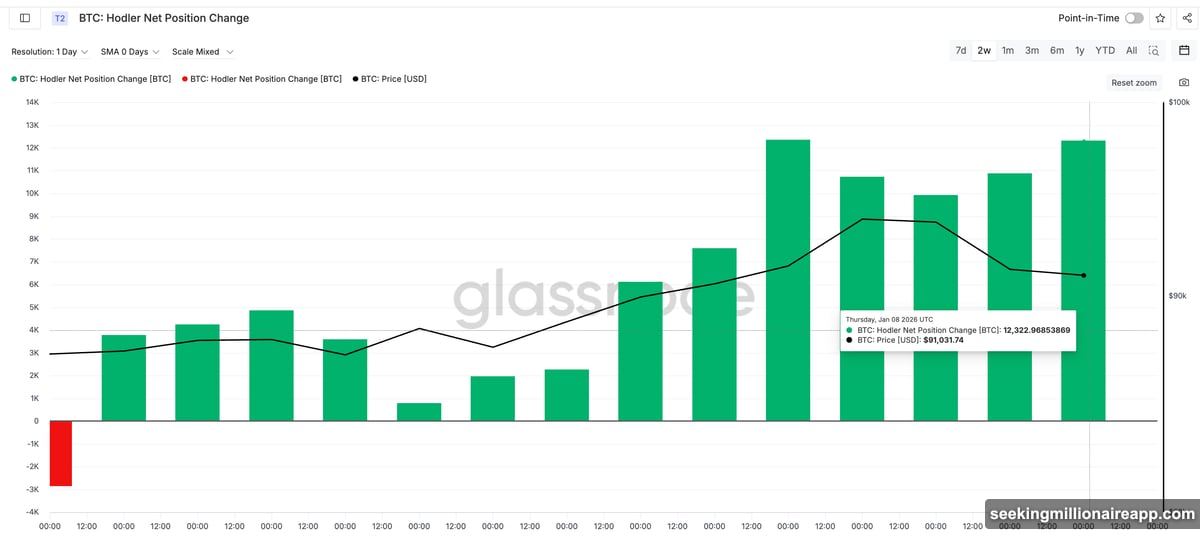
This behavior marks a clear reversal. Through late December, holders were still distributing despite occasional rallies. That pattern just flipped. Now they’re adding during weakness instead of selling into strength.
This matters because it shows conviction building at lower prices. Smart money tends to accumulate when retail panics.
Short Leverage Stacked $2.6 Billion Near Breakout Zone
Derivatives positioning creates breakout fuel. Currently, it’s heavily skewed.
Perpetual futures liquidation data shows about $3.9 billion in cumulative short exposure compared to roughly $2.3 billion on the long side. Shorts outweigh longs by nearly 70%.
This imbalance creates mechanical pressure. When price rises, short positions must close by buying Bitcoin. That adds buy orders to the market, often accelerating moves once resistance breaks.
The largest short cluster sits near $94,820. Roughly $2.6 billion in short exposure concentrates around this level. Importantly, this zone aligns almost perfectly with the cup-and-handle neckline.
So here’s the setup. Spot buyers accumulated during weakness, building the base. Meanwhile, leverage positioned itself in a way that could amplify any upside move. The two triggers are now in place.
Three Price Levels Decide the Breakout
Bitcoin faces three critical zones. Each determines whether the 12% measured move triggers.
The first hurdle sits at $92,390. A sustained break above this level would push Bitcoin out of the handle consolidation. That’s step one.
Next comes $94,900. This is the key level. A daily close above this zone would accomplish three things simultaneously. It would clear the neckline, break above the massive short liquidation cluster, and potentially trigger forced buying as shorts cover.
If both levels break, the measured move from the cup-and-handle pattern points to roughly 12% upside. That targets the $104,000 to $107,250 region. Some interim resistance might appear near $96,700 along the way.
Downside remains defined too. Holding above $88,340 keeps the structure intact. A break below $86,560 weakens it. Moving under $84,310 would invalidate the pattern entirely.
The Catalysts Are Lined Up
Bitcoin isn’t breaking down. Instead, it’s compressing.
Momentum indicators confirm price strength rather than contradict it. Long-term holders are accumulating during dips instead of distributing into rallies. Meanwhile, derivative positioning has stacked nearly $4 billion in short exposure, with the largest cluster sitting right at the pattern’s neckline.
That’s not coincidence. It’s setup.
Whether this triggers depends entirely on reclaiming $92,390 and then $94,900. Until then, it remains potential rather than reality. But the pieces are in position. Spot accumulation built the foundation. Leverage positioning created the fuel.
Now price action decides whether a 12% move toward $104,000 actually happens. The next few days will show if buyers can convert this setup into an actual breakout.