Bitcoin’s breakout setup looks solid on paper. The chart structure checks out. Short-term panic selling dried up. But there’s a problem.
Every time Bitcoin pushes toward $92,400, it hits a wall. Someone’s selling into strength. The culprit? Ultra-long-term holders who’ve been sitting on coins for over a year.
They’re not dumping aggressively anymore. Selling dropped 60% in recent days. But they haven’t stopped either. That’s keeping Bitcoin trapped in a tight range despite what should be bullish conditions.
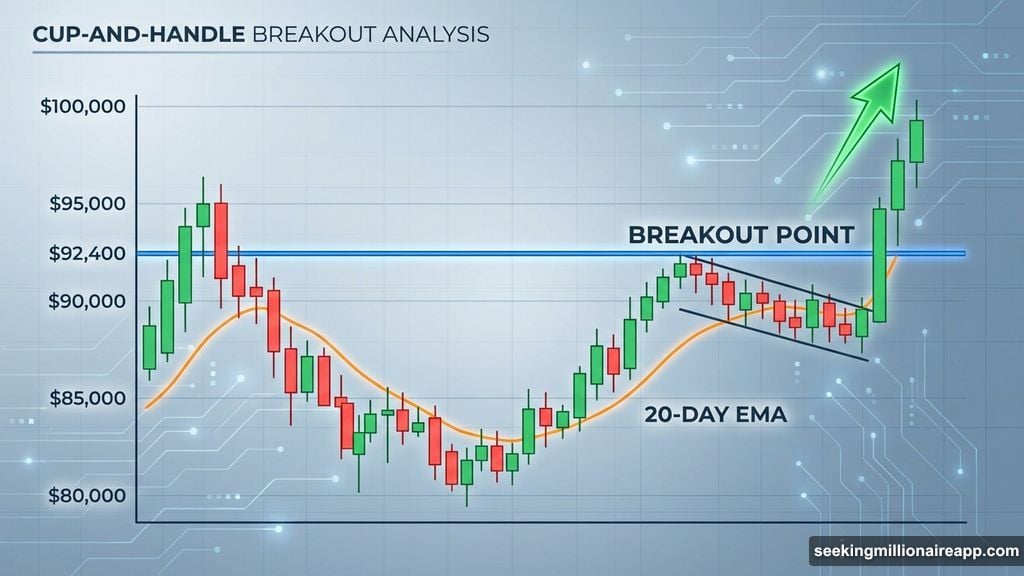
The Cup-and-Handle Structure Still Works
Bitcoin’s daily chart shows a textbook cup-and-handle pattern. This formation typically signals continuation after a pause. The “cup” formed over several weeks. The “handle” represents the recent consolidation.
The breakout point sits around $92,400. Bitcoin briefly tested that level before pulling back. But the structure didn’t break. As long as one key support holds, the bullish case remains valid.
That support is the 20-day exponential moving average. An EMA weighs recent price action more heavily than older data. It helps identify short-term trend direction.
Bitcoin reclaimed the 20-day EMA on January 10. Then it printed two consecutive green daily candles. This sequence matters more than most traders realize.
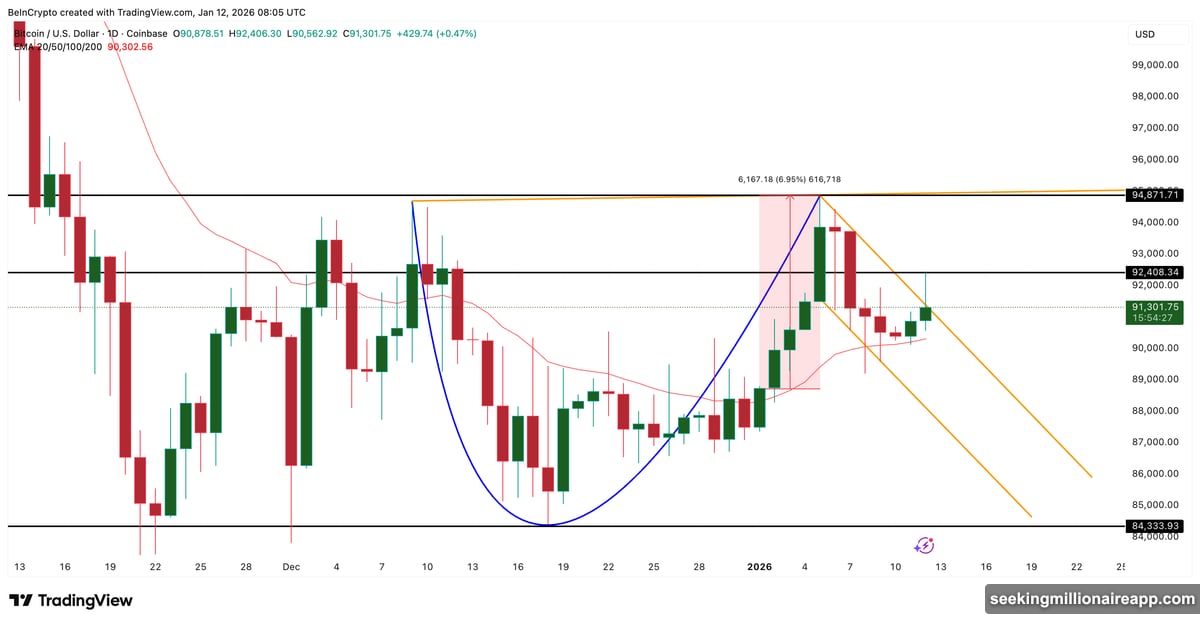
In December, Bitcoin reclaimed the 20-day EMA twice. Both times failed because the next candle closed red. On January 1, the reclaim held with a green follow-through candle. That led to a nearly 7% rally.
The same setup is forming now. As long as Bitcoin stays above the 20-day EMA, the breakout theory stays alive. But those long upper wicks near $92,400 tell a different story. Supply is active at resistance.
So who’s selling?
Short-Term Holders Went Silent
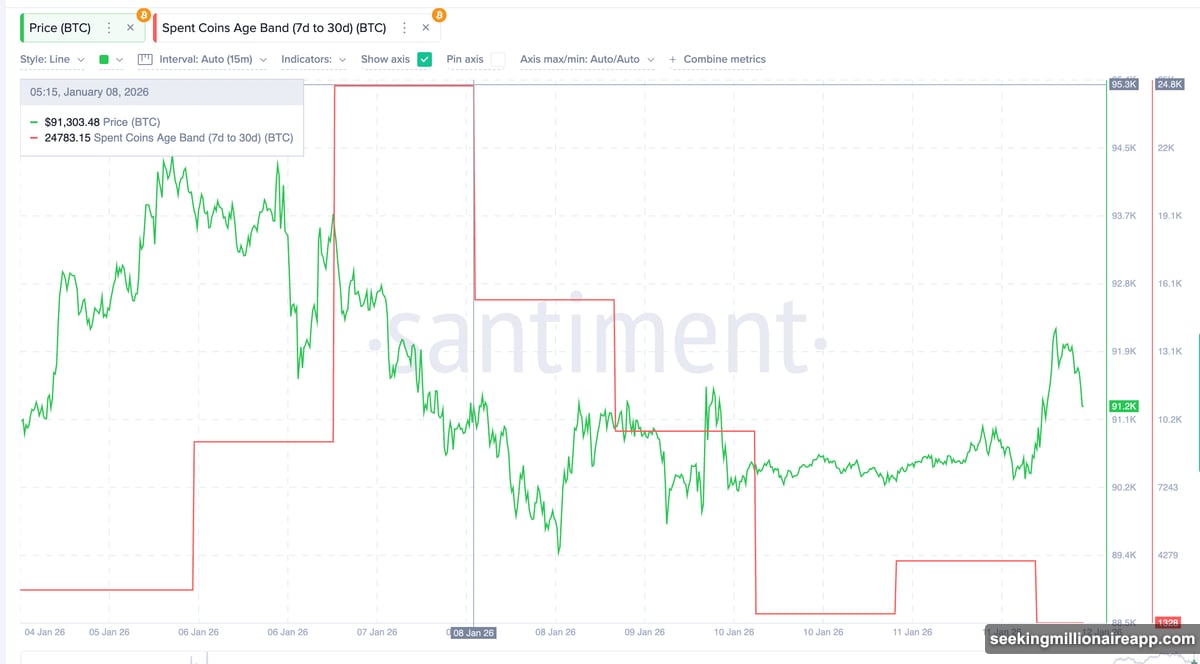
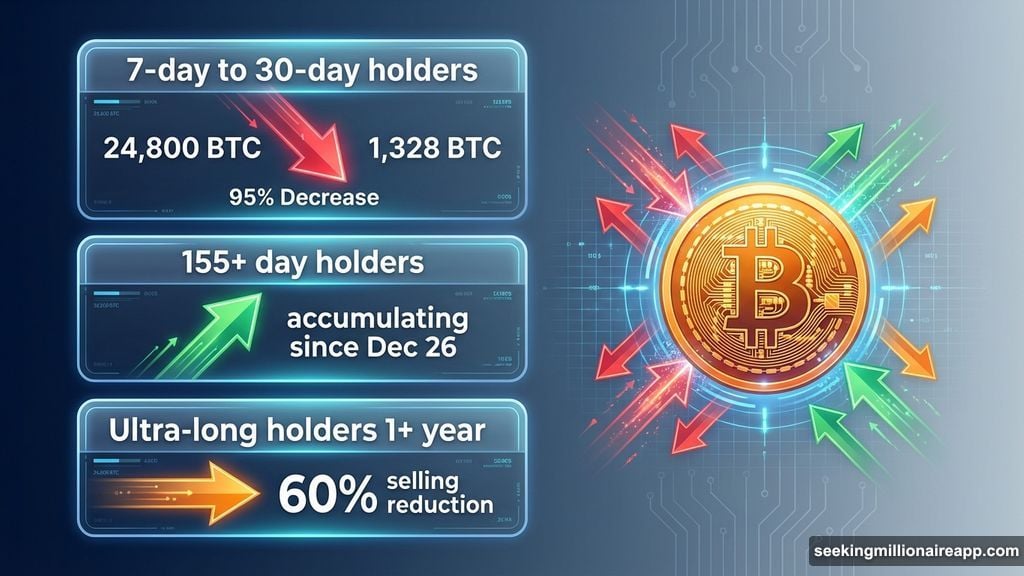
On-chain data reveals the selling groups. Recent buyers basically stopped selling. Spent Coins Age Band data tracks coin movement by holder age. The 7-day to 30-day cohort shows a massive decline in activity.
This group moved about 24,800 BTC on January 8. By now, that number collapsed to just 1,328 BTC. That’s a 95% drop in selling pressure from short-term holders.
Translation? People who bought in the last month aren’t rushing to take profits during this bounce. They’re holding.
Meanwhile, standard long-term holders turned buyers. These are investors who typically hold for 155 days or longer. Their net position change flipped positive on December 26. They’ve been accumulating since then.
In fact, they kept buying even when Bitcoin peaked on January 5. That’s unusual. It suggests confidence in higher prices ahead. Long-term investors don’t usually buy the top unless they expect another leg up.
So short-term sellers disappeared. Long-term buyers showed up. Perfect bullish setup, right?
Not quite. There’s a third group messing things up.
Ultra-Long Holders Are Still Distributing
The oldest Bitcoin holders are the problem. These are wallets that have held coins for well over a year, possibly multiple years. They’re often called “whales” or “OGs.”
Their net position change remains negative. On January 1, this cohort distributed roughly 286,700 BTC. By January 11, that number dropped to about 109,200 BTC.
That’s a 60% reduction in selling pressure. Progress, definitely. But they’re still net sellers. And that’s enough to cap upside momentum near resistance.
Think about it. Short-term panic is gone. Smart money is buying. But old supply keeps hitting the market every time Bitcoin approaches $92,400. That creates a ceiling.
This explains the hesitation. Every push higher meets supply. Not because retail is scared. Not because institutions are selling. But because ultra-long holders are taking profits after holding through multiple cycles.
Can’t really blame them. If you bought Bitcoin under $10,000 or even under $1,000, selling near $90,000 makes sense. But it does slow down the breakout.
The Key Levels That Matter Now
Bitcoin needs a clean daily close above $92,400 to unlock the next move. Breaking that level would complete the cup-and-handle pattern. It would also trigger the measured 12% upside target.
That projects toward $106,630. Not a random number. It’s based on the depth of the cup and the breakout point. Pattern-based targets work surprisingly often in crypto.
For this to happen, two things need to align. First, Bitcoin must stay above the 20-day EMA. Second, ultra-long holder selling needs to stop or at least slow down further.
On the downside, watch $89,230. A daily close below that level would weaken the bullish structure. It wouldn’t kill the breakout theory entirely, but it would raise doubts.
A deeper drop toward $84,330 would invalidate the setup completely. Below that, the cup-and-handle pattern no longer applies. The market would need to rebuild a new base.
Right now, Bitcoin sits between these two outcomes. The structure favors bulls. Short-term selling vanished. Long-term investors are buying. But the oldest holders are distributing just enough supply to delay the move.
Why This Matters More Than You Think
This isn’t just about one resistance level. It reveals how Bitcoin moves in 2026. The market structure changed. Retail panic doesn’t move prices anymore. Short-term traders aren’t driving volatility.
Instead, we’re watching a battle between different holder cohorts. New long-term buyers want higher prices. Old long-term holders want to take profits. Whoever wins determines if Bitcoin breaks out or consolidates longer.
The good news? Ultra-long holder selling is slowing. It dropped 60% already. If that trend continues, the supply wall near $92,400 will thin out. Once it does, the delayed breakout could move fast.
Markets that consolidate while absorbing supply tend to explode when resistance finally breaks. That’s because all the weak hands already sold. All the profit-takers already exited. What’s left is strong hands ready to push higher.
Bitcoin’s breakout story isn’t dead. It’s just waiting for the oldest holders to finish selling. Once they step aside, the 12% move to $106,630 could happen quickly.