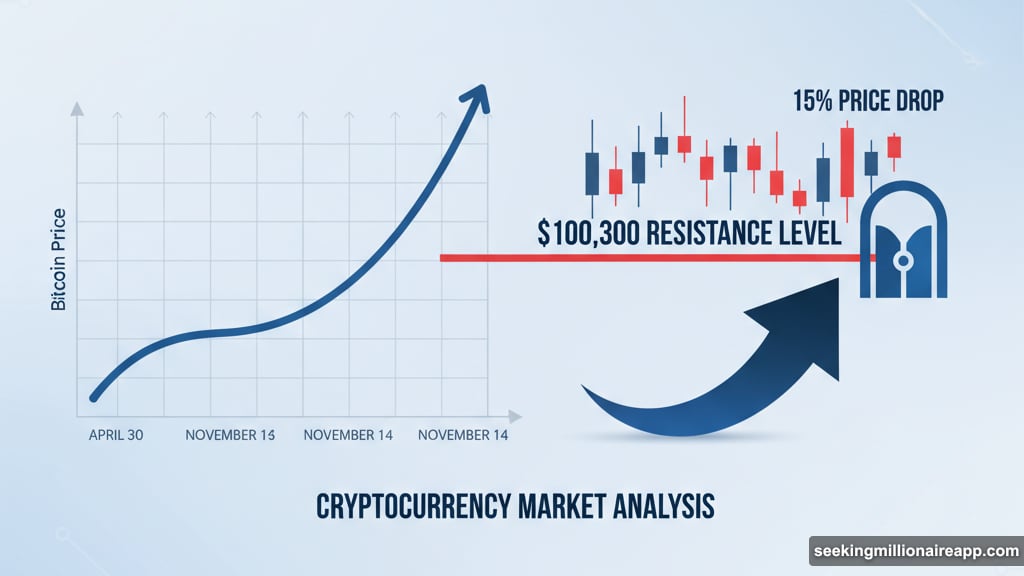
Bitcoin just hit a wall. After months of steady gains, the world’s largest cryptocurrency dropped 15% since early November. Now it sits at a critical junction where one price level determines everything.
The question isn’t whether Bitcoin will recover. It’s whether bulls can push price back above the line that separates a temporary dip from something worse.
Hidden Strength Shows Up in Momentum Data
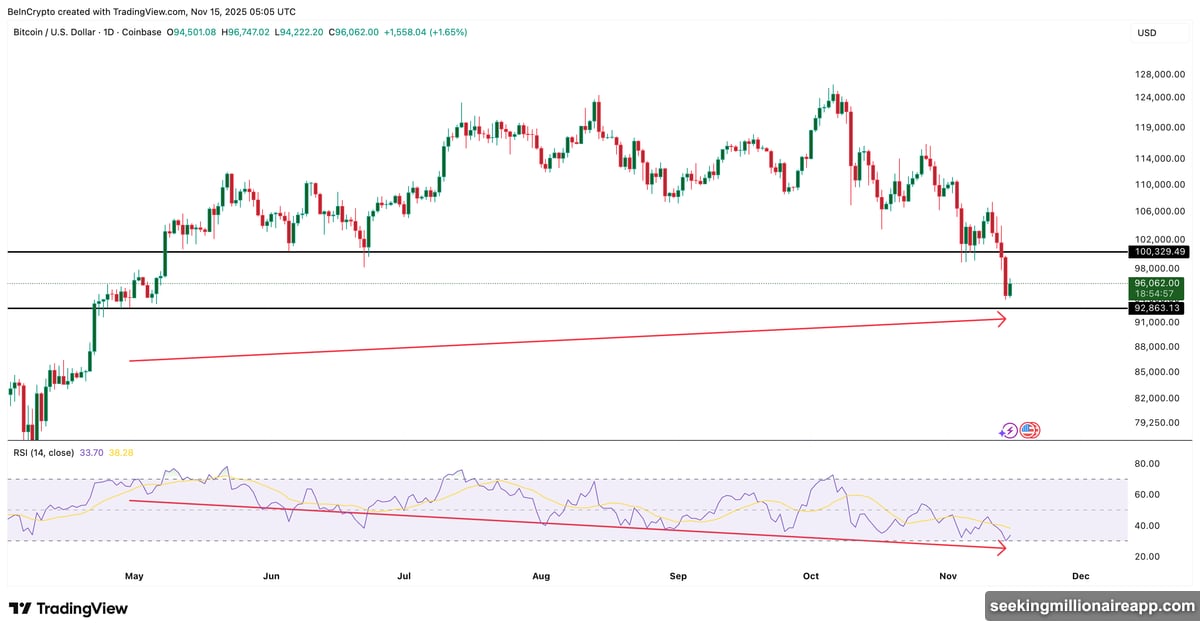
Technical indicators reveal something interesting. The Relative Strength Index dropped into oversold territory this week, then reversed. That typically signals selling pressure is fading.
Moreover, a longer pattern emerged between April 30 and November 14. Bitcoin formed a higher low during this period. Meanwhile, the RSI made a lower low. Traders call this hidden bullish divergence, a pattern that often appears when strong trends pause before resuming.
But here’s the catch. None of this matters unless Bitcoin price closes above $100,300. That level acted as reliable support since late April. Now it’s flipped to resistance.
Think of it like a gate. The momentum signals point toward recovery. But the gate stays locked until price pushes through that specific barrier.
Supply Concentration Creates Critical Decision Point
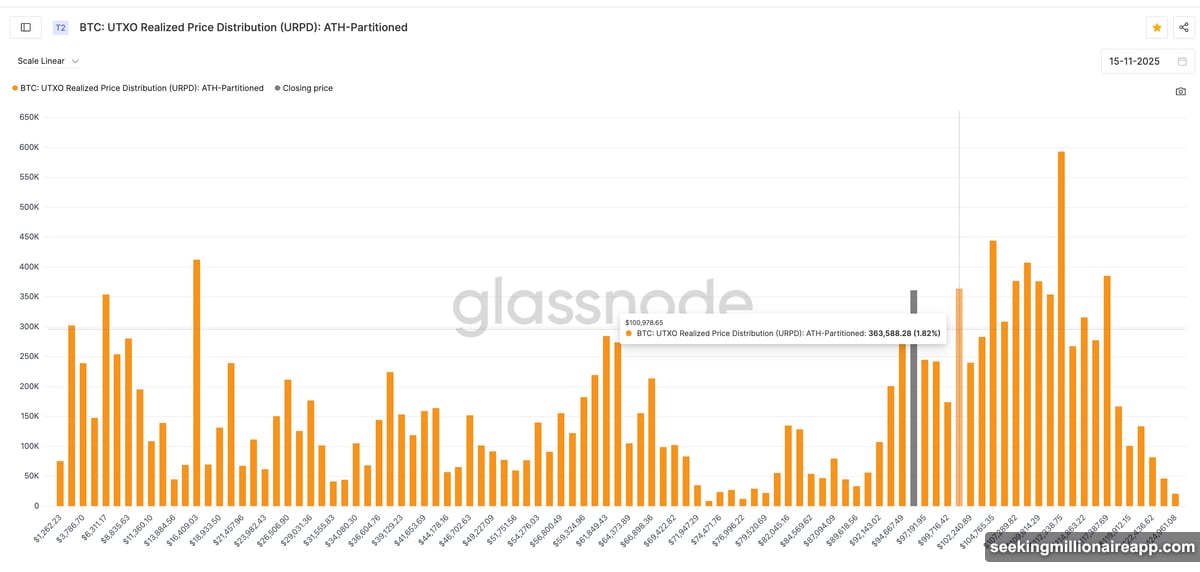
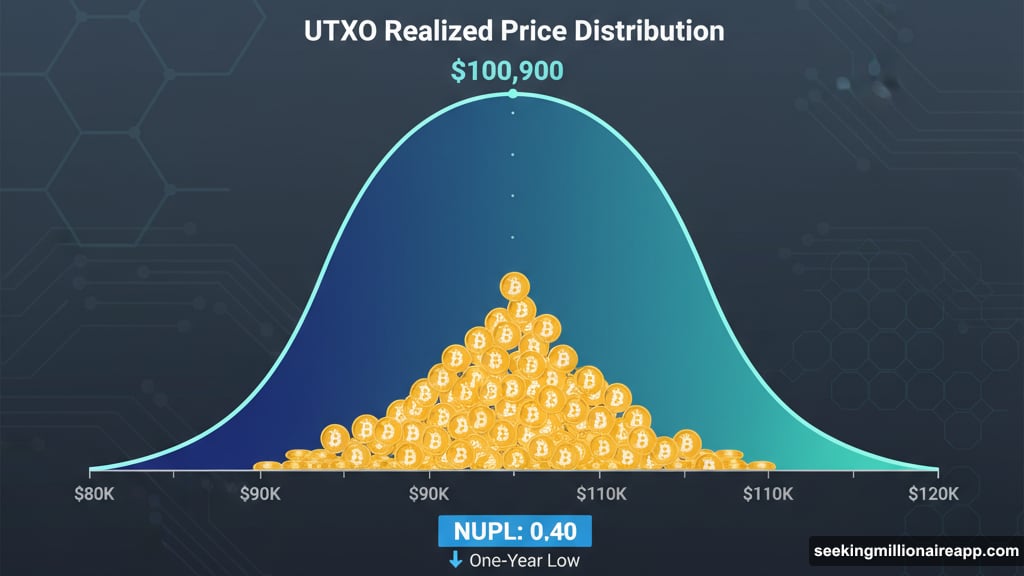
On-chain data confirms why $100,300 matters so much. The UTXO Realized Price Distribution shows a massive cluster of long-term Bitcoin holdings created near $100,900.
When large amounts of supply concentrate at similar price points, those zones become battlegrounds. Holders at that level decide whether to sell, hold, or buy more. Their collective actions can accelerate moves in either direction.
This supply cluster sits right at the resistance level identified through momentum analysis. So two independent metrics point to the same conclusion. Bitcoin must reclaim this zone to validate any rebound theory.
Without that move, all the bullish indicators remain theoretical.
Profit Margins Hit One-Year Low
The Net Unrealized Profit/Loss metric tells another part of the story. NUPL measures the difference between current price and the average purchase price across all Bitcoin holders.
Right now, NUPL sits at 0.40. That’s the lowest reading in a year. It means the market holds very thin unrealized profits, similar to early-cycle conditions when rebounds typically form.
The last time NUPL dropped this low was April. From that point, Bitcoin rallied roughly 46% in less than two months. History doesn’t repeat exactly. But the market just entered familiar pressure zones where recoveries often start.
Yet again, this bottoming signal only activates if price confirms it. NUPL can stay low for extended periods during bear markets. The difference between a bounce and a breakdown depends entirely on whether Bitcoin reclaims that $100K zone.
Falling Channel Holds Key to Direction
Bitcoin currently trades inside a falling channel on daily charts. This pattern maintains the bearish short-term trend.
Breaking out requires two steps. First, regain $100,300. Then close a daily candle above $101,600. That would flip the old support back to support and strengthen the recovery case.
If momentum builds from there, the next target sits near $106,300. A close above that level pushes Bitcoin completely outside the falling channel. The trend shifts from bearish to neutral, with potential to turn bullish if buying pressure increases.
The downside risk sits underneath. The channel’s lower band only touched price twice. That makes it structurally weak support. If Bitcoin loses the $93,900–$92,800 zone, the pattern breaks down. Deeper levels open up fast.
Plus, losing that support kills the “extended cycle” narrative many analysts promoted throughout 2024. It would force traders to reassess whether this cycle follows historical patterns or creates new rules.
Two Scenarios Play Out From Here
The market now faces a binary choice. Above $100,300, stabilization begins. Momentum indicators activate. Supply zones flip from resistance to support. The bottoming case gains credibility.
Below $93,900, everything changes. The falling channel breaks down. Thin support underneath means faster drops. The cycle-extension theory collapses. Bears take full control.
No middle ground exists at this junction. Bitcoin either reclaims its former support or slides into a deeper correction. The next few days determine which path unfolds.
Most corrections end at logical support levels. This one sits at a psychological milestone that held for months. Whether it holds again decides if bulls get another chance or bears claim victory.
The answer matters for more than short-term trades. It shapes expectations for the entire 2025 outlook. Recovery here means the bull market likely continues. Breakdown suggests months of consolidation or worse.
Right now, Bitcoin hovers between boom and bust. One level separates them. Price action over the next week reveals which side wins.