
Bitcoin is painting a pretty picture on the charts right now. But underneath that tidy technical setup, the data tells a much messier story.
BTC trades near $71,800 today, up about 2.9% over the past month. A classic rounded bottom pattern on the daily chart points to an 11% breakout target near $81,720. That sounds exciting. However, open interest is falling, spot outflows have dropped by more than half, and long-side conviction has quietly evaporated. The structure is there. The momentum behind it? Not so much.
The Rounded Bottom Pattern Taking Shape
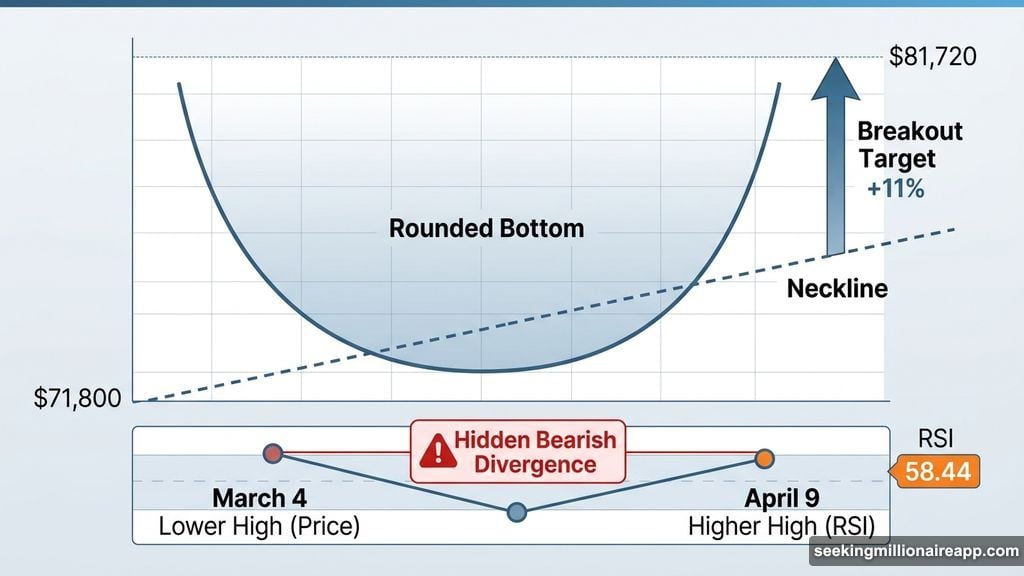
On Bitcoin’s daily chart, a rounded bottom has formed with a slightly upward-slanting neckline. The cup shape completed after weeks of gradual recovery from late March lows. Then, since the April 9 local peak, price has started consolidating — which could eventually shape into the handle portion of the pattern.
So technically, this looks constructive. But momentum is flashing a warning sign.
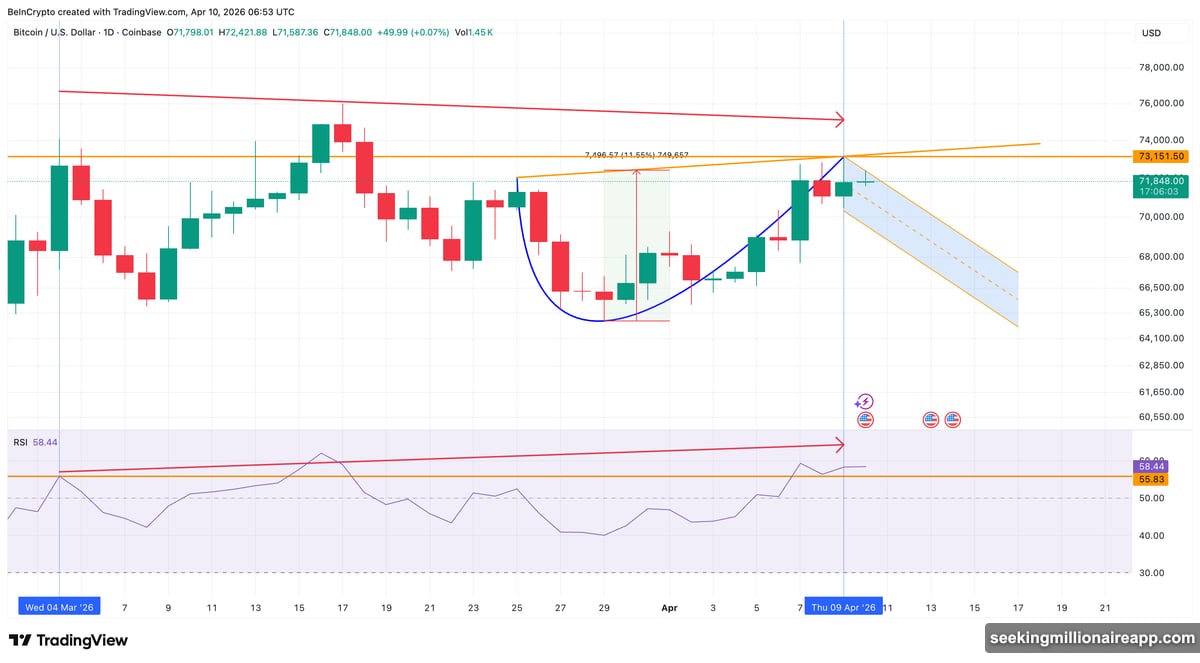
The Relative Strength Index (RSI), which measures buying and selling pressure, currently sits at 58.44. Between March 4 and April 9, price printed a lower high while RSI printed a higher high. That’s called hidden bearish divergence — a pattern that often signals downtrend continuation rather than reversal.
In plain terms? The recent consolidation may have further to run before any real breakout attempt materializes. Despite trading up 2.9% month-over-month, BTC remains down 17% year-to-date. That bigger picture context matters.
Derivatives Cooling Off Fast
Here’s where things get interesting — and a little concerning.
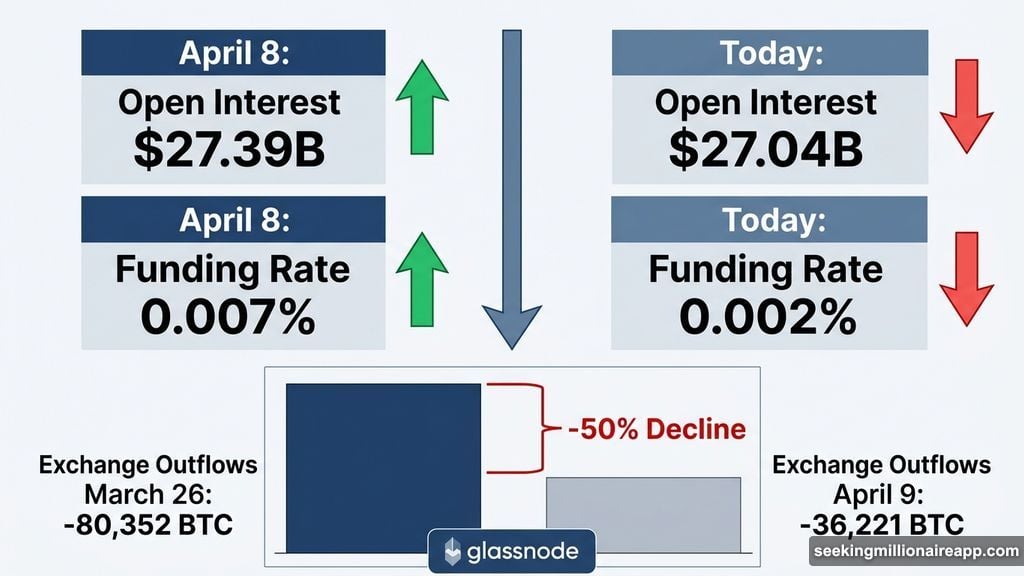
On April 8, when BTC traded near $72,300, total open interest sat at $27.39 billion. The funding rate, which measures the cost of holding long positions, was at 0.007%. That level showed aggressive long-side conviction driving the rally.
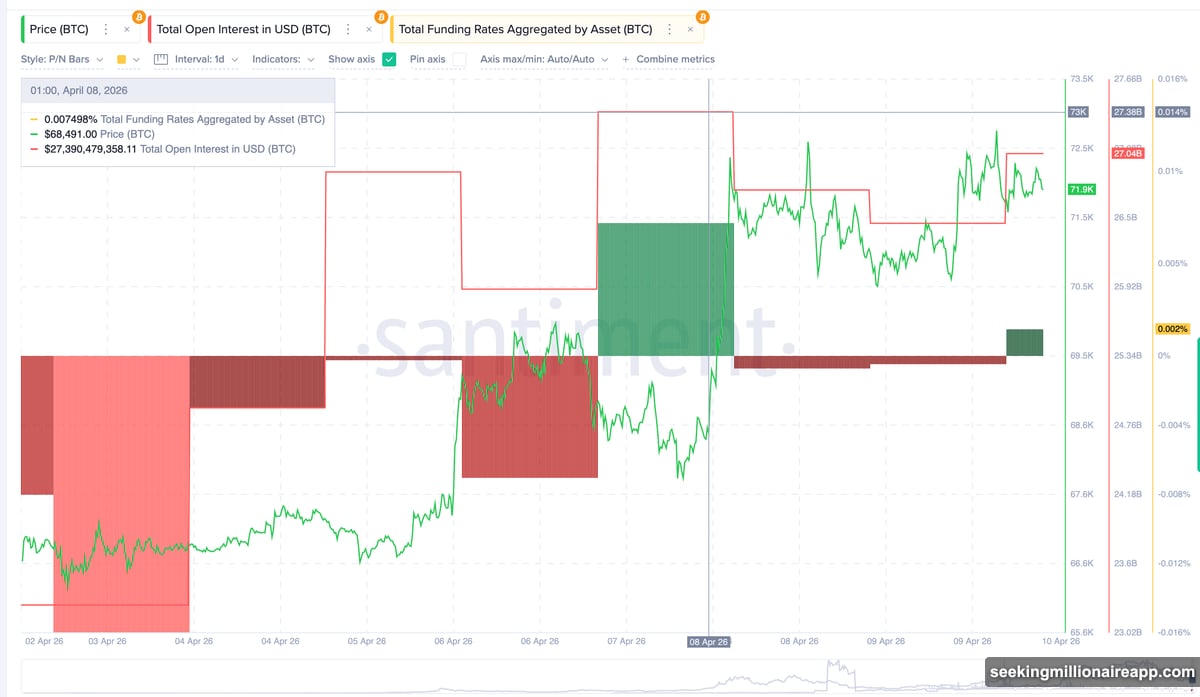
Fast forward to today. At a nearly identical price near $71,900, open interest has slipped to $27.04 billion. Funding dropped all the way down to 0.002%. Fewer traders are betting on further upside right now.
That’s a double-edged situation. Less leverage means fewer positions to get liquidated if prices dip — which actually reduces downside risk somewhat. But it also means less fuel to push higher. And without that fuel, even a clean breakout attempt could run out of steam quickly.
Spot Exchange Outflows Have Halved
The derivatives picture isn’t the only soft spot. Spot market data from Glassnode tells a similar story.
Bitcoin’s exchange net position change — a metric that tracks how many tokens are moving in and out of exchanges — peaked at negative 80,352 BTC on March 26. That kind of large negative reading signals strong outflows from exchanges, meaning buyers were pulling coins off platforms to hold them. That’s generally bullish behavior.
But that figure has since dropped to negative 36,221 BTC as of April 9. That’s a decline of more than 50% in just a couple of weeks.
During the March 22 to March 25 rally — when BTC climbed from $67,860 to $71,303 — exchange outflows were at their strongest. Spot buyers were engaged and showing urgency. Now, as price approaches similar territory, that same urgency simply isn’t showing up.
The breakout structure exists. The buyers needed to confirm it are still sitting on the sidelines.
The Exact Price Levels That Matter
For the rounded bottom to become a confirmed breakout, Bitcoin needs to close above a very specific zone on the daily chart.
The neckline of the pattern and the 0.618 Fibonacci retracement level converge between $73,151 and $73,240. A clean daily close above $73,240 would confirm the pattern. From there, the measured move projects about 11% higher, placing the target near $81,720.
That’s the bullish case. And it’s a compelling one — if conviction shows up.
But if Bitcoin fails to reclaim $73,151, the pullback deepens. The first support level sits at $70,065. Below that, $64,920 becomes critical. A drop to that level would break the entire bullish structure entirely.
So right now, BTC sits in a genuinely tricky spot. The technical pattern is real and well-formed. But with open interest declining, funding rates nearly flat, and spot outflows cut in half, the fuel gap is the primary risk.
A daily close above $73,240 puts $81,720 in play and gives the bulls something real to work with. A rejection at the neckline keeps Bitcoin range-bound and lets that bearish RSI divergence play out further. Without a surge in fresh leverage or renewed spot buying pressure, the more likely short-term path might be continued consolidation rather than a clean breakout.
The chart is ready. The question is whether the market is.