
Bitcoin Hit $70,000 Fast. But This Bull Market Is Still Fragile
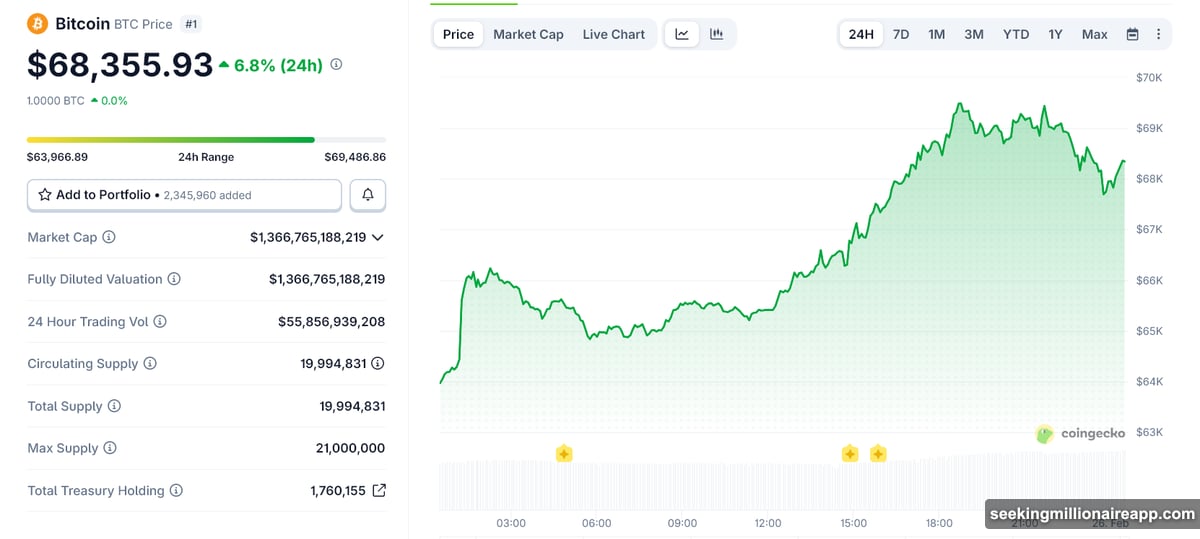
Bitcoin just surged toward the $70,000 mark. Naturally, everyone wants to know if the brutal bear market is finally over.
But the underlying data tells a complicated story. In fact, multiple indicators suggest this might just be a temporary pause in the pain.
Let’s look at what the numbers actually reveal behind the scenes.
Options Market Positioning Shows Fragility
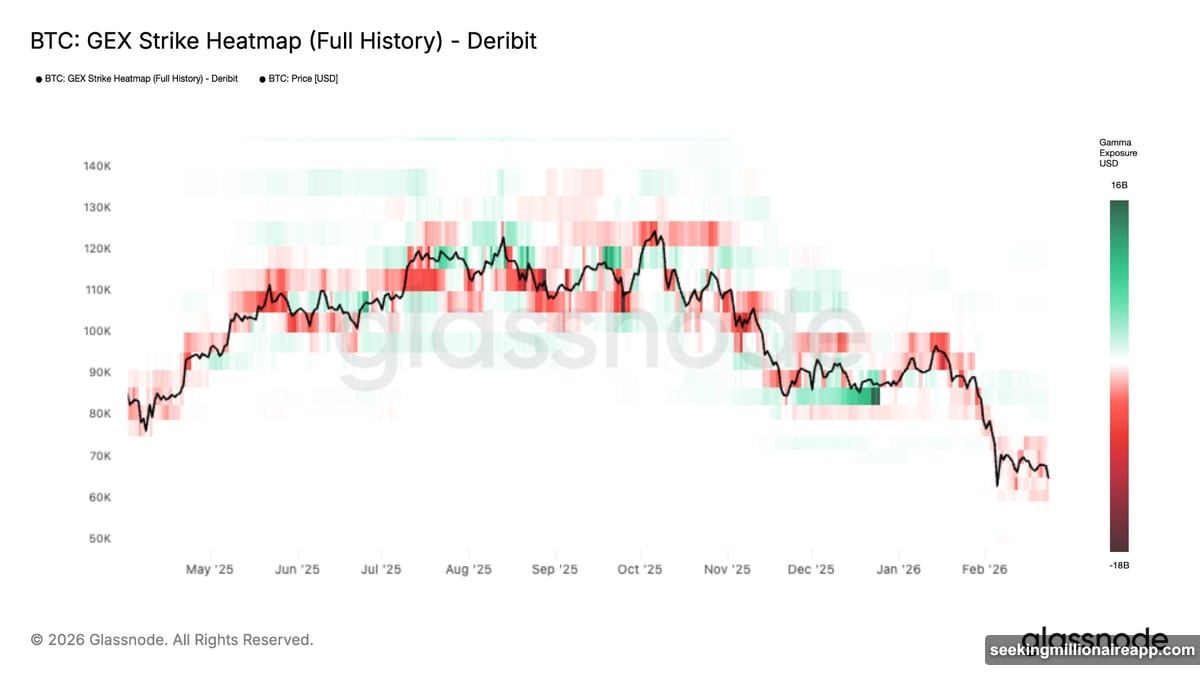
Bitcoin’s options market sits in a negative gamma zone right now. Basically, this means market makers are hedging their risk differently. So, price swings can happen incredibly fast in either direction.
Plus, there is very little structural resistance above current prices. That explains why the price jumped so quickly this week. However, it also means the market lacks a solid foundation to prevent sudden crashes.
Spot Demand Growth Offers Some Hope
On the bright side, we are seeing some positive momentum. Specifically, Bitcoin spot demand just turned positive for the first time since late November.
This metric simply tracks whether people are buying more than miners are producing. Therefore, buyers are finally stepping up to absorb coins from sellers. Yet, one good week does not confirm a massive trend reversal.
Short-Term Holders Face Harsh Capitulation
Meanwhile, newer investors are still feeling the pain. Data shows short-term holders have been selling at a loss consistently since late January.

This pattern represents classic market capitulation. Essentially, weaker investors are cutting their losses and exiting the market. But until these newer buyers start selling at a profit again, any price jumps could just be an excuse for trapped investors to cash out.
Institutional ETF Outflows Remain Weak
However, the big money is still incredibly hesitant. Institutional flows remain surprisingly weak right now.
For example, large advisors and hedge funds heavily reduced their exposure recently. Overall, these massive players sold roughly 25,000 Bitcoin through ETFs in the fourth quarter of 2025. Thus, we need these massive institutions to return before a true bull run begins.
RSI Technical Indicators Point to Relief
Also, technical charts do show some encouraging signs. The relative strength index recently bounced back from extreme lows in early February.
Historically, this signals that heavy selling pressure is finally easing up. So, the worst of the recent dump might be behind us for now.
So, where does this leave normal investors? Bitcoin is definitely showing early signs of finding a bottom. But we are absolutely missing the crucial confirmation needed for a full market reversal.
Instead of rushing in blindly, watch the institutional money. I recommend waiting for sustained ETF inflows and steady spot demand before celebrating. For now, treat this price action as a nice relief bounce rather than a permanent victory.