
Bitcoin sellers just hit the panic button. Exchange inflows exploded over 1,300% in two days as short-term holders dumped coins. Yet the price barely budged from $105,300.
Something doesn’t add up. When selling pressure spikes that hard, prices usually crater. Instead, Bitcoin dipped to $100K briefly, then bounced right back. That resilience points to powerful buyers absorbing every sell order.
The on-chain data tells a story most traders are missing.
Short-Term Holders Flood Exchanges With BTC
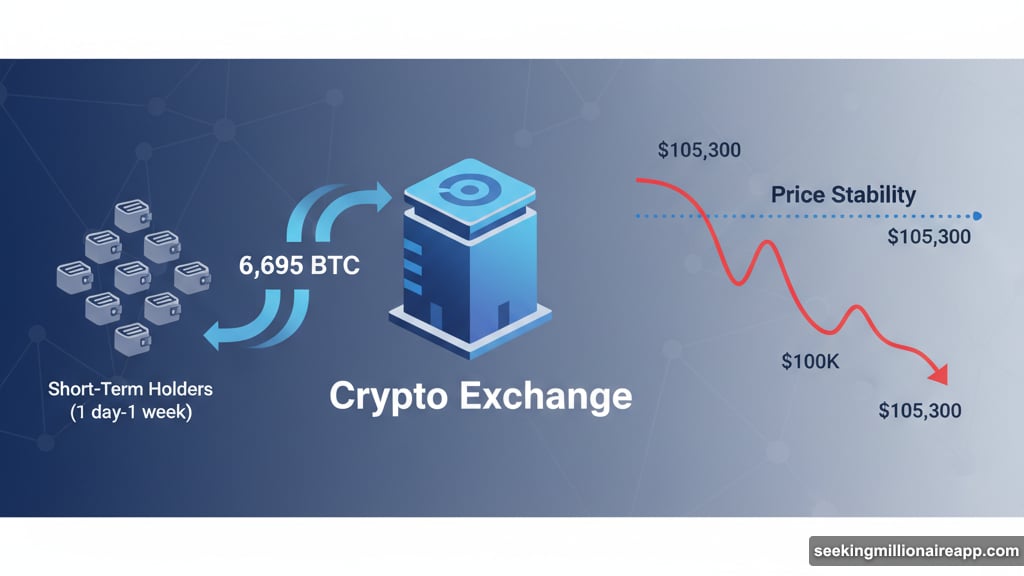
The numbers look brutal at first glance. Short-term Bitcoin wallets (holding coins for 1 day to 1 week) ramped up exchange transfers from 470 BTC on November 8 to 6,695 BTC on November 10. That’s a 1,323% surge in just 48 hours.
Meanwhile, mid-term holders joined the exit. Wallets aged 6 months to 1 year increased their exchange deposits from 268 BTC to 1,125 BTC. Another 320% jump in selling pressure.
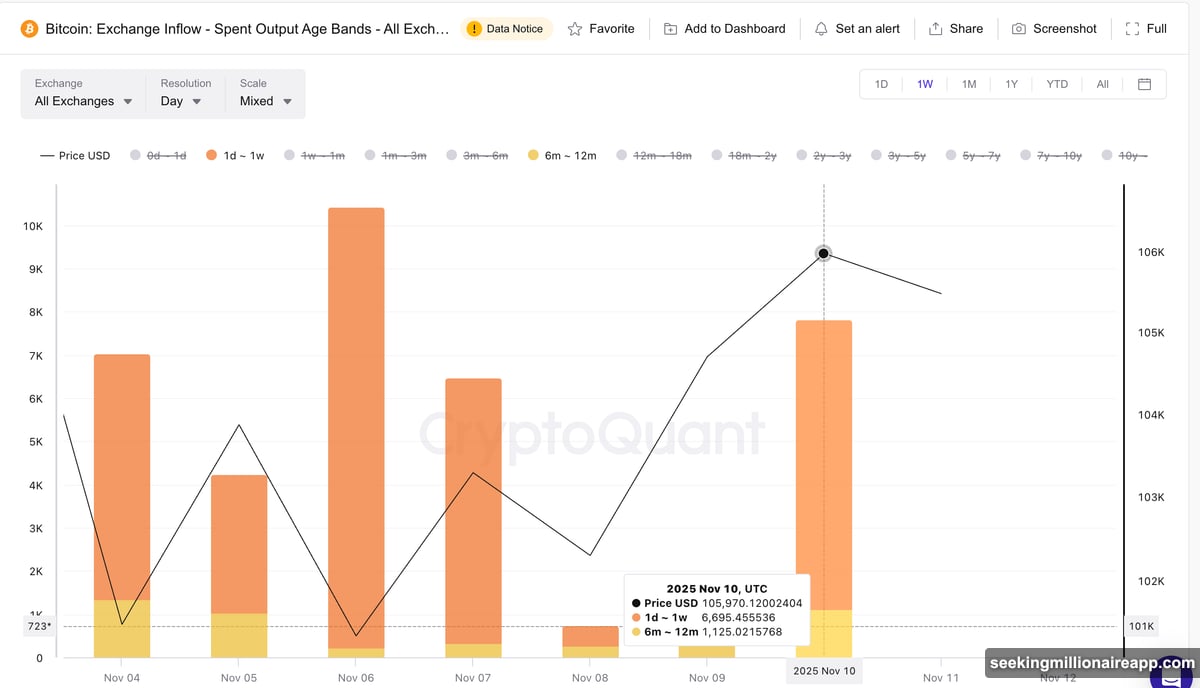
These aren’t random wallet movements. They represent real profit-taking at resistance zones. Short-term speculators bought the dip below $100K and are now cashing out. Mid-term investors are banking gains after holding through volatility.
But here’s what matters. All that selling should have crushed the price. Instead, Bitcoin held above $103,000 most of the week. Someone’s buying everything sellers throw at the market.
Technical Signal Hints at Coming Rally
The chart setup strengthens the bull case. Bitcoin’s 20-day exponential moving average is converging with the 50-day EMA. When the faster 20-period crosses above the slower 50-period, momentum typically shifts bullish.
This exact pattern played out in late October. After the crossover completed around October 25, Bitcoin rallied over 5% within days. Now the same signal is forming again near $105,300.
EMAs smooth out price noise and react faster than simple moving averages. So when both align bullishly while the price holds key support, it often precedes further gains. Traders watch these crossovers closely because they confirm that buying pressure is building beneath surface volatility.

Plus, the crossover is happening despite massive selling. That divergence between technical strength and on-chain distribution suggests smart money is quietly positioning for the next leg up.
Whales Absorb 26,000 BTC in Four Days
Large holder data confirms the accumulation thesis. Wallets containing over 1,000 BTC increased from 1,362 to 1,388 between November 6 and November 10. That’s a 1.9% rise in whale addresses.
At current prices near $105,300, those 26 new whale wallets represent roughly 26,000 BTC absorbed — about $2.74 billion in fresh buying. These aren’t retail traders panic-buying dips. Whales deliberately accumulated during the sell-off while short-term holders fled.
This dynamic explains why Bitcoin price remained stable despite the selling spike. Every time short-term wallets dumped coins on exchanges, whale buyers stepped in to absorb the supply. That created a floor above $103,000 that held through the week.
However, continued accumulation isn’t guaranteed. If whales stop buying or begin distributing themselves, the next sell wave could break support levels. For now, though, large holders appear confident enough to keep adding.
Key Levels That Determine What Happens Next
Bitcoin faces immediate resistance at $105,500. That zone rejected every rally attempt since November 9. A clean daily close above it opens the path to $109,700, which has capped price action since October 31.
Beyond that, targets include $112,600 and potentially $116,400. But reaching those levels requires two things. First, whale accumulation must continue offsetting short-term selling. Second, the 20-50 EMA crossover needs to complete and hold.
On the downside, $102,900 marks critical short-term support. A daily close below that invalidates the bullish structure and could expose $98,800 or lower. That would likely trigger stop-loss cascades and force leveraged longs to exit.
So the current setup is fragile. The bulls have momentum and whale support. Yet sellers remain active, and resistance zones are nearby. Small moves either direction could trigger larger reactions.

The Real Story Behind Bitcoin’s Resilience
Markets don’t usually shrug off 1,300% surges in selling pressure. When exchange inflows spike that hard, prices typically follow downward. But Bitcoin held firm above $100K, even bouncing to $105K quickly.
That tells me large players see value here. They’re using short-term panic to accumulate size without moving the market against themselves. Every dip gets bought, every resistance level defended.
Yet I’m cautious about calling this a definitive bottom. Sellers haven’t disappeared — they just got temporarily overwhelmed by buyers. If whale demand weakens or profit-taking accelerates, the next dip could break support and force a deeper correction.
Watch the $105,500 level closely. A breakout above it confirms the rebound is real. A rejection there suggests we’re still range-bound, vulnerable to the next wave of selling. The EMA crossover adds confidence, but crossovers fail sometimes too.
Bitcoin’s holding strong for now. Whether it can sustain momentum through heavier resistance remains the open question.