
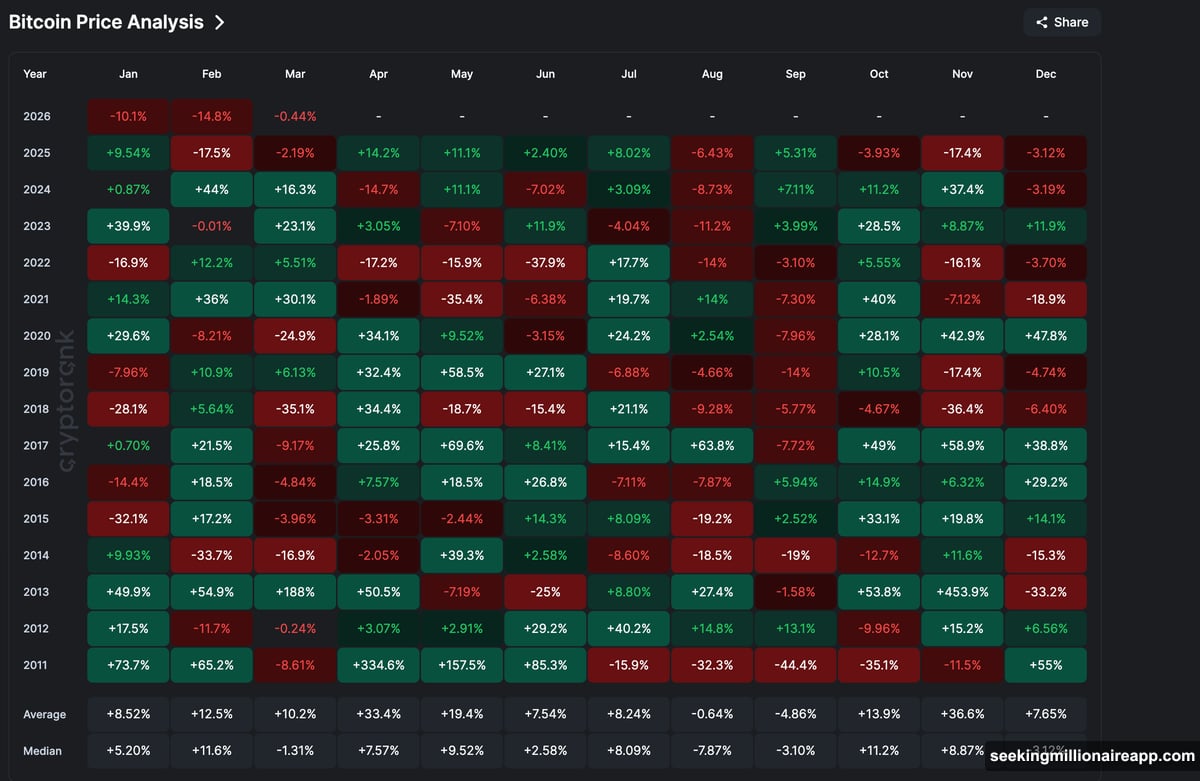
February left Bitcoin bruised. BTC dropped nearly 15% last month, almost matching February 2025’s brutal 17% slide. Now five consecutive red months stretch back to October 2025, and the seasonal data isn’t exactly cheering anyone up — the median March return for Bitcoin sits at a quiet −1.31%.
But dig beneath the surface, and something interesting is happening. Selling is drying up. Whales are quietly buying. And ETF outflows have collapsed by 94% from their November peak. So does March bring relief, or just a brief pause before more pain?
Here’s what the data actually shows.
Bitcoin Still Moves With Stocks
The most uncomfortable truth about Bitcoin right now? It’s trading like a tech stock, not a hedge.
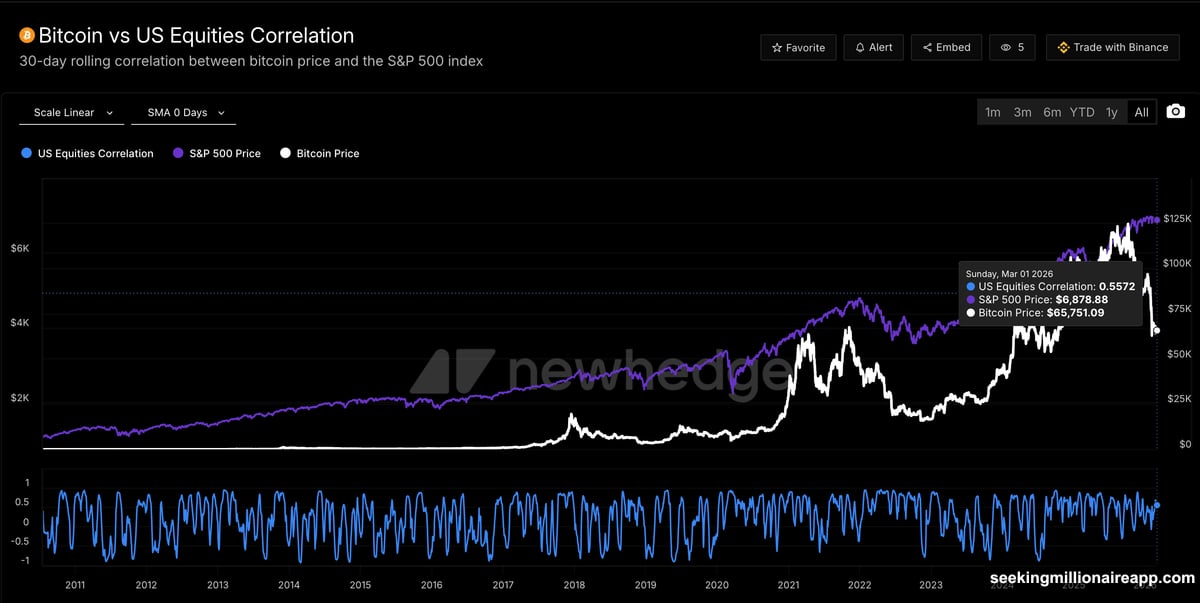
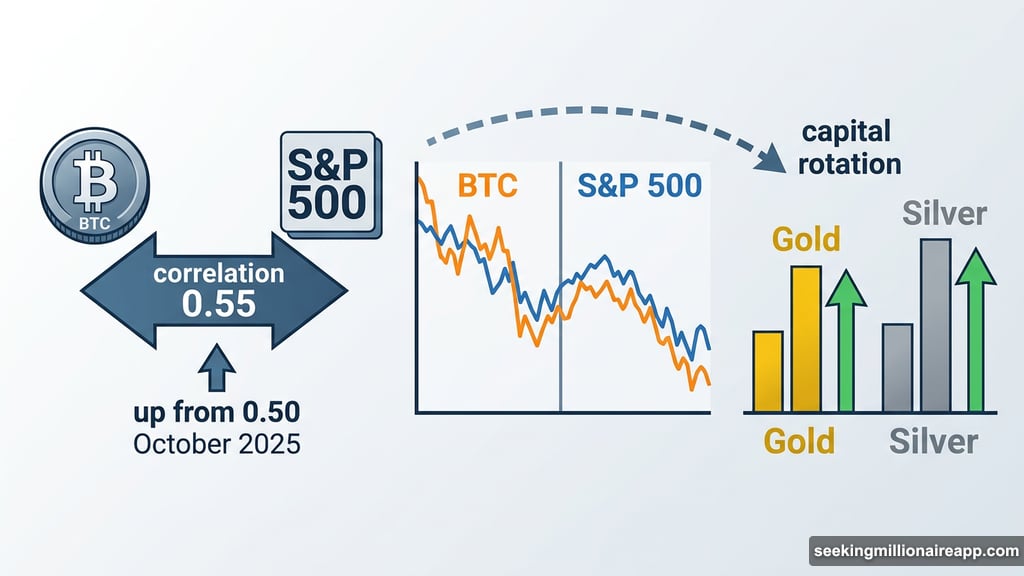
As of March 1, the 30-day rolling correlation between Bitcoin and the S&P 500 sits at 0.55, up from 0.50 in October 2025. That’s meaningful. When equities sneeze, Bitcoin catches a cold.
Kevin Crowther, Founder of KC Private Wealth, put it bluntly. “Bitcoin’s high correlation to software stocks weakens its case as a hedge asset in times of uncertainty, and so as Trump continues to elevate economic uncertainty, continued BTC weakness should be expected,” he said.
Meanwhile, gold and silver are surging while Bitcoin bleeds. That capital rotation hasn’t reversed yet. However, if geopolitical tensions ease — particularly around Iran — and the gold trade becomes crowded, some investors may start eyeing Bitcoin as the next uncrowded opportunity. That shift depends entirely on whether the equity correlation softens.
ETF Outflow Streak Is Quietly Fading
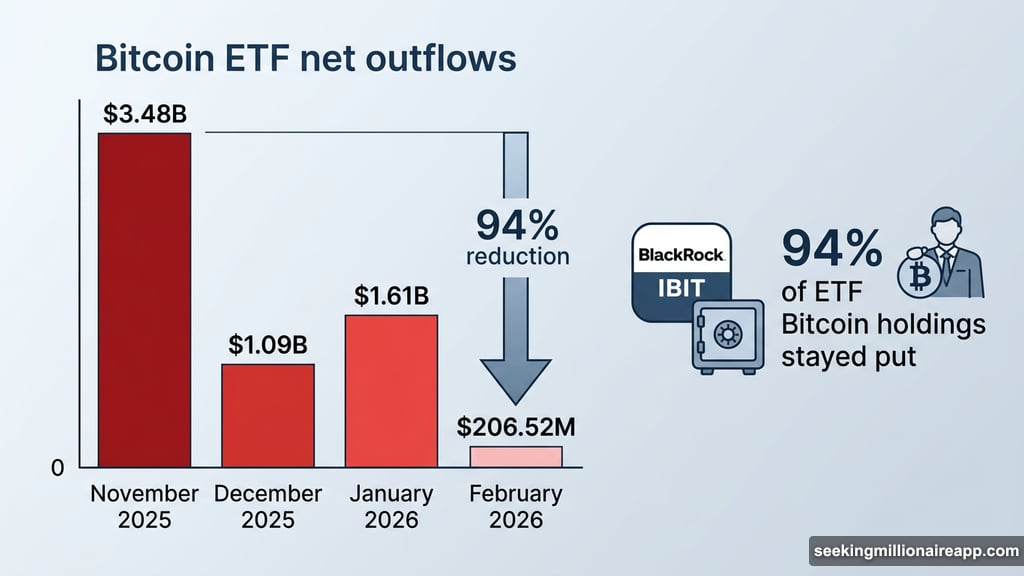
Spot Bitcoin ETFs have posted four consecutive months of net outflows. That sounds bad. But the trend inside that streak tells a much more encouraging story.
November 2025 saw $3.48 billion drain out. December brought $1.09 billion in outflows. January added another $1.61 billion. Then February closed at just $206.52 million — a 94% reduction from the November peak.
Orkun Mahir Kılıç, Co-Founder of Citrea, framed this carefully. “The ETF outflows are more consistent with deleveraging than institutional abandonment. For flows to reverse meaningfully, markets need clearer macro direction and lower volatility,” he explained.
Nima Beni, Founder of Bitlease, went further. Even BlackRock’s IBIT posting $2.13 billion in outflows didn’t rattle him. “ETF outflows are retail panic, creating institutional opportunity. That’s institutional conviction, not abandonment,” Beni said. He pointed out that 94% of ETF Bitcoin holdings stayed put despite maximum fear in the market.
The panic selling through ETFs appears to be exhausting itself. That’s a meaningful shift.
Long-Term Holders and Miners Are Pulling Back on Selling
On-chain data tells a similar story. Both long-term Bitcoin holders and miners dramatically slowed their selling through February.
Long-term holders — wallets that have held Bitcoin for at least 365 days — are often the last to fold. When their selling stops, it typically signals a price floor forming nearby. On February 5, their 30-day rolling net position change showed −243,737 BTC leaving those wallets. By March 1, that figure had dropped to just −31,967 BTC. That’s an 87% reduction in selling pressure from this critical group.
Miners followed the same pattern. Peak miner selling hit −4,718 BTC around February 8. By March 1, that eased to −837 BTC. The worst of miner capitulation may already be behind us.
Han Tan, Chief Market Analyst at Bybit, added important nuance here. He noted that Bitcoin’s hashrate decline doesn’t signal panic — it signals efficiency adjustments. “Bitcoin miners aren’t capitulating; they’re making strategic diversifications,” Tan said. Lower Bitcoin prices and higher energy costs naturally push some miners to shut off machines temporarily, reducing the total computing power securing the network. That’s normal market behavior, not collapse.
Whale Accumulation Near a Key Moving Average
While selling exhausts itself at the top, buying is quietly picking up at the bottom — specifically among the biggest wallets on the network.
Wallets holding between 100,000 and 1,000,000 BTC added from 676,540 to 690,000 BTC around February 19-20, during a brief 4.06% price bounce. Importantly, they haven’t sold since. Smaller whale wallets holding 1,000 to 10,000 BTC also began accumulating from February 25, rising from 4.222 million to 4.23 million BTC.
Why the timing? The 20-day Simple Moving Average (SMA) sits at $67,100 — just above where Bitcoin currently trades. The last time Bitcoin decisively crossed this level was January 1, and it immediately rallied over 12%. Whales appear to be positioning for a similar move.
But the longer-term picture demands more patience. The 50-day SMA sits at $77,200, and the 200-day SMA — the level that would genuinely confirm a bullish cycle reversal — looms far above at $96,800. Han Tan from Bybit highlighted what it would take to bring broader buyers back. “Bitcoin may have to resurface above its 50-day SMA and reclaim the psychological $80,000 handle before more buyers are enticed back into the fold,” he said.
The Bear Flag Nobody Wants to Talk About
Here’s the uncomfortable part. On the three-day chart, Bitcoin currently trades inside a bear flag.
For the uninitiated, a bear flag forms when prices drop sharply, then bounce slightly upward within two parallel lines — almost like the market catching its breath before continuing lower. The original drop that formed this pattern measured roughly 39%. If that pattern completes, a similar 39% decline from the breakdown point becomes the technical target.
Making this worse, a hidden bearish divergence appeared on the Relative Strength Index (RSI) between February 6 and February 24. Bitcoin printed a lower price high during that stretch, but RSI printed a higher reading. That mismatch suggests underlying momentum still favors the downside, even during bounces.
The critical levels to watch this month are clear. On the upside, $71,300 is the first meaningful resistance. A sustained move above $79,000 would technically invalidate the bear flag entirely. On the downside, a breakdown below $62,300 opens the door to Fibonacci support at $56,800, then $52,300, $47,800, and — in worst-case scenarios — $41,400.
Kılıç offered a contrarian read on all this fear. “Extreme fear and the deepest ETF outflow streak in a year aren’t bearish signals. I’d actually define them as classic capitulation, flushing out weak hands and tightening supply,” he said. Crowther, meanwhile, kept expectations grounded. “Flat, or slightly positive price movement throughout March should be an investor’s base case scenario for now,” he added.
What March Likely Holds
Putting all of this together, March looks like a month of two distinct halves.
The first half likely brings a local bounce. Selling exhaustion from long-term holders and miners, collapsing ETF outflows, and active whale accumulation all point in that direction. A run toward the 20-day SMA at $67,100 — and potentially the $71,300 resistance zone — seems plausible given current dynamics.
But a local bounce isn’t the same as a cycle recovery. The bear flag structure remains intact until Bitcoin closes above $79,000. And the macro environment — equity correlation, tariff uncertainty, geopolitical pressure — hasn’t turned friendly yet.
March will probably come down to one question: does $62,300 hold as support, or does $79,000 break as resistance? Whichever happens first sets the direction for everything that follows. Right now, the on-chain data gives the bulls a slightly better case for the short term. The charts, however, remind you not to get too comfortable.