October 2025 proved that billion-dollar crashes don’t appear from nowhere. The $19 billion liquidation event that shocked markets came with clear warnings weeks before it happened.
Most traders blamed tariff news. But on-chain data tells a different story. The structural weakness was already there, hiding in plain sight.
Here’s what those signals looked like and how to spot them next time.
The October Long Squeeze Built Up Over Two Weeks
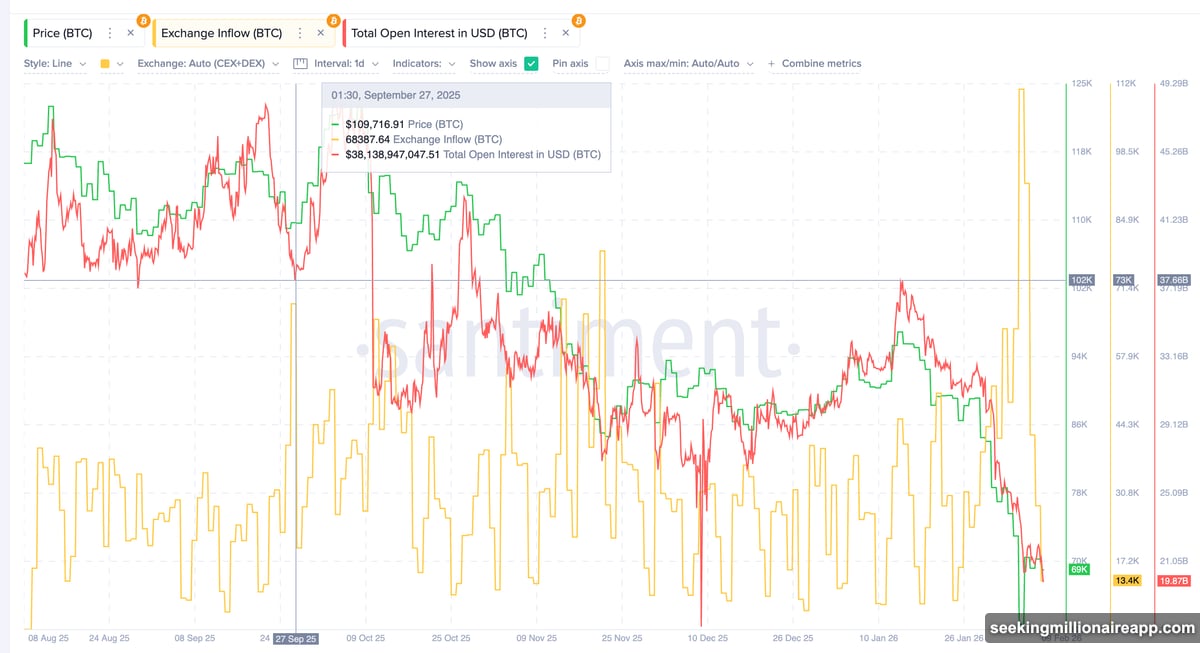
Between September 27 and October 5, Bitcoin rallied hard. Price jumped from $109,000 to above $122,000, eventually testing $126,000. That rapid climb looked bullish. Instead, it set up the perfect trap.
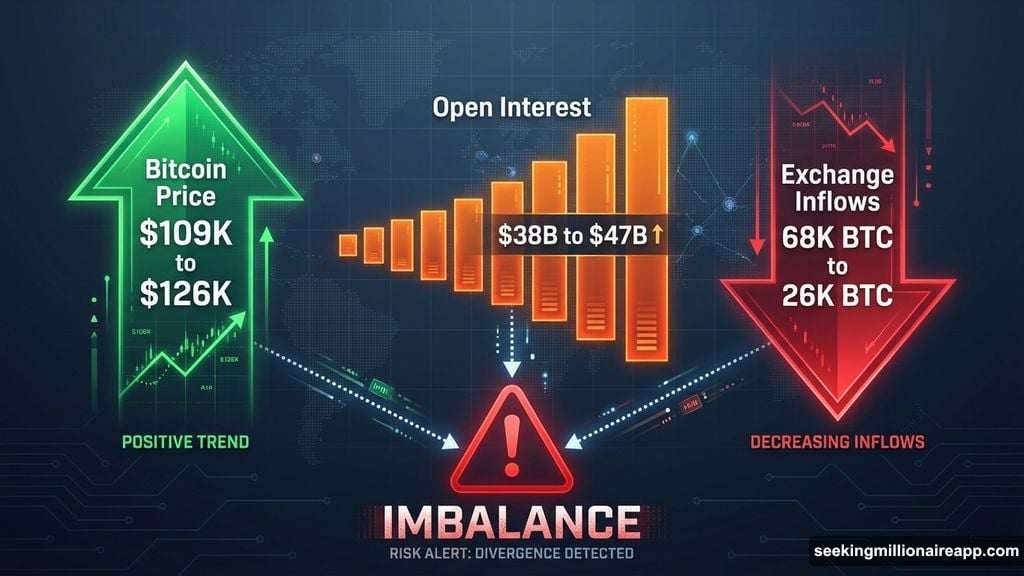
Open interest exploded during that same period. It surged from roughly $38 billion to more than $47 billion. Traders piled into leveraged long positions, expecting further upside.
Meanwhile, exchange inflows collapsed. They dropped from around 68,000 BTC to near 26,000 BTC. Holders weren’t selling into strength. They were keeping coins off exchanges while leverage ballooned.
That combination created dangerous imbalance. Rising leverage plus stagnant spot participation equals fragile structure.
Gracy Chen, CEO of Bitget, explained how modern markets amplify these risks. Positions build and unwind faster across more venues now. When stress hits, the cascade becomes sharper and more correlated.
Profit-Taking Started Before Anyone Noticed
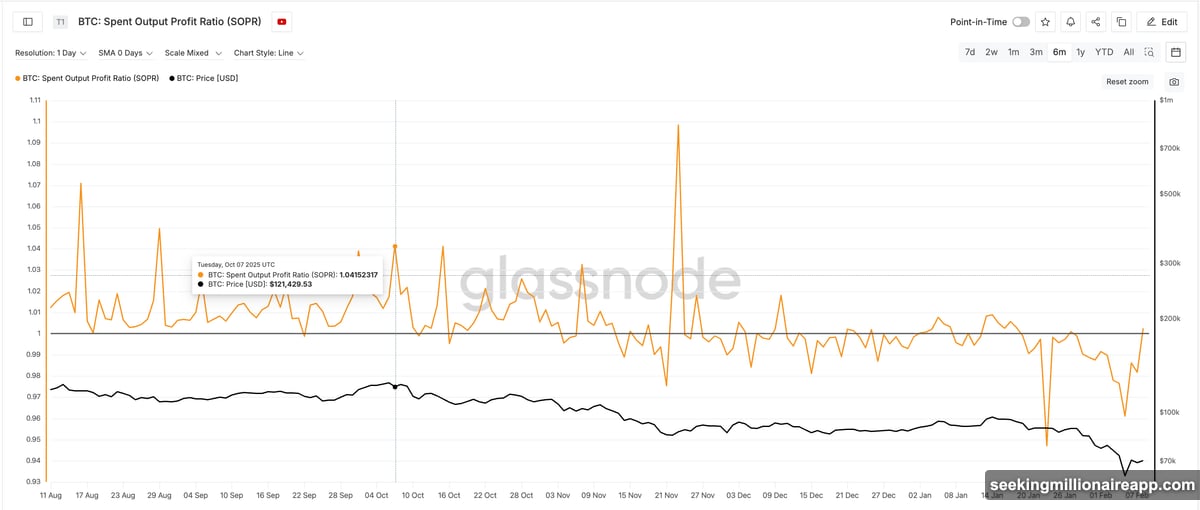
The Spent Output Profit Ratio (SOPR) revealed early distribution. From late September into early October, SOPR climbed from around 1.00 to roughly 1.04 with repeated spikes.
This meant more coins were being sold at profit. Importantly, this happened while exchange inflows stayed low. Early buyers were quietly locking in gains without triggering visible selling pressure.
Plus, Bitcoin was already at all-time highs during that period. That context made the quiet profit-taking even more significant. Smart money was exiting while retail added leverage.
Short-Term Holders Flipped Too Fast
Short-term holder Net Unrealized Profit/Loss (STH-NUPL) provided one of the clearest warnings. On September 27, STH-NUPL stood near -0.17, reflecting recent capitulation. By October 6, it had surged to around +0.09.
Recent buyers moved from heavy losses to clear profits in less than ten days. That rapid transition is dangerous. Traders who just escaped losses become highly sensitive to pullbacks and eager to protect small gains.
So sentiment improved while leverage continued rising. Open interest reached record levels as SOPR and NUPL began rolling over. Instead of reducing exposure, traders increased it.
Momentum Weakened For Months Before
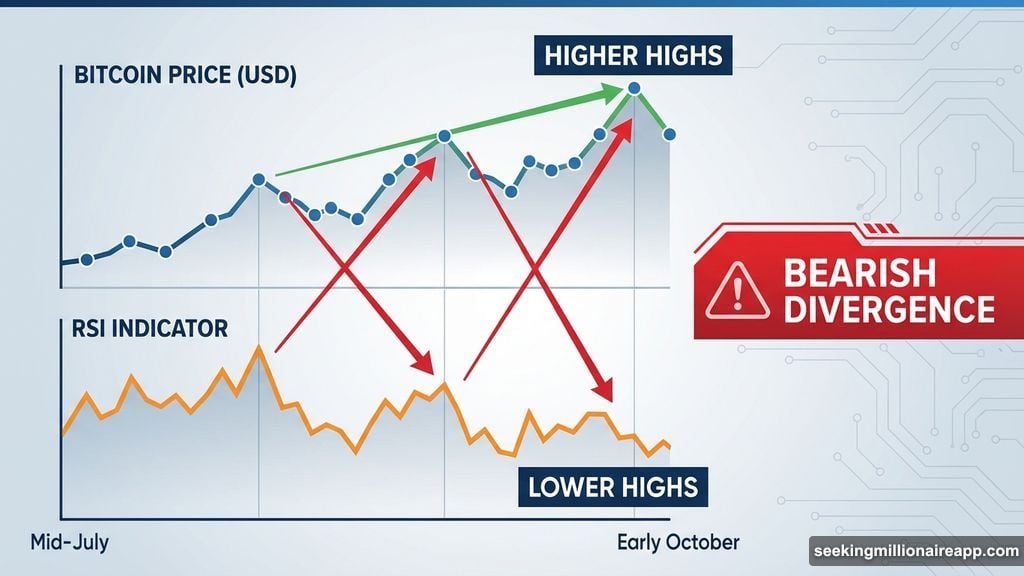
Technical indicators showed deterioration long before the crash. From mid-July to early October, Bitcoin formed clear bearish RSI divergence. Price made higher highs while the Relative Strength Index made lower highs.
This signaled weakening demand beneath the surface. By early October, the rally was increasingly sustained by leverage rather than organic buying. The momentum indicator proved it clearly.
Traders Defended Positions Instead Of Exiting
After October 6, price momentum faded and support levels got tested. Despite this, open interest remained elevated and funding rates stayed positive. Traders were defending positions rather than exiting, possibly by adding margin.
Chen noted that attempts to defend positions often amplify systemic risks. When positions approach liquidation, traders add margin. Individually, that makes sense. Systemically, it increases fragility. Once those levels fail, the unwind becomes a cascade.
More margin eventually led to deeper crash. That’s exactly what happened on October 10.
The Trigger Finally Arrived
When tariff-related headlines emerged on October 10, the weak structure collapsed. Price broke lower, leveraged positions moved into loss, and margin calls accelerated.
Open interest fell sharply. Exchange inflows surged. Forced selling created a feedback loop, producing the largest liquidation cascade in crypto history. More than $17 billion in long positions got wiped out.
Stephan Lutz, CEO of BitMEX, said liquidation cycles tend to appear repeatedly during periods of excessive risk-taking. They’re actually good for market health because they clear excess leverage.
Chen cautioned that liquidations are an accelerant, not the ignition. They tell you where risk was mispriced and how thin liquidity really was underneath.
April’s Short Squeeze Followed Similar Pattern
April 23, 2025 triggered more than $600 million in short liquidations in a single session. While the rally appeared sudden, derivatives data show that fragile structure had been forming for weeks.
Between late February and early April, Bitcoin made lower lows. However, the RSI formed bullish divergence with higher lows even as price declined. This signaled that selling pressure was weakening.
Yet exchange outflows continued falling. They dropped from around 348,000 BTC in early March to near 285,000 BTC by April 8. Dip buyers remained hesitant and accumulation stayed limited.
Bearish Positioning After Bottom
On April 8, Bitcoin formed a local bottom near $76,000. Instead of reducing risk, traders increased bearish exposure. Funding rates turned negative, indicating strong short bias.
At the same time, open interest rose toward $4.16 billion on Bybit alone. New leverage was being built primarily on the short side. Most traders expected the bounce to fail and prices to move lower.
Exchange outflows continued declining toward 227,000 BTC by mid-April. Both retail and institutional participants stayed bearish.
On-Chain Data Showed Selling Exhaustion
SOPR was near or below 1 and failed to sustain profit or loss spikes. This indicated that loss-driven selling was slowing, even when buying wasn’t picking up pace. That’s a classic bottom signal.
Short-term holder NUPL remained in negative territory. It stayed in the capitulation zone with only shallow rebounds, reflecting low confidence and limited optimism.
Together, these signals showed exhaustion rather than renewed demand.
Market Compressed Into Unstable Range
By mid-April, Bitcoin entered a narrow trading range. Volatility declined while open interest remained elevated and funding stayed mostly negative. Shorts were crowded, yet prices failed to break lower and began stabilizing instead.
With selling pressure fading but no meaningful spot accumulation emerging, the market became increasingly dependent on derivatives positioning. Buyers remained hesitant while bearish leverage continued rising against weakening downside momentum.
This imbalance made the market structurally unstable.
Short Squeeze Followed Similar Sequence
By April 22-23, STH-NUPL moved back toward positive territory. Recent buyers had returned to small profits. Some holders were now able to sell into strength, while many traders still treated the rebound as temporary and added short exposure.
The difference from October was context. In October, short-term holders turning profitable encouraged more long positioning. In April, the same return to small profits encouraged more short positioning, as traders viewed the rebound as temporary.
When prices pushed higher, stop losses triggered, short covering accelerated, and open interest dropped sharply. Forced buying created a feedback loop. A positive tariff-related tweet helped produce one of the largest short liquidation events of 2025.
These Warning Signs Appear Before Every Cascade
Both events shared three features. First, open interest increased while spot flows weakened. Second, funding remained strongly one-sided for several days. Third, short-term holder NUPL shifted rapidly shortly before forced liquidations.
These patterns also appear during mid-trend pullbacks and relief rallies. When leverage expands faster than spot conviction and emotional positioning becomes one-sided, liquidation risk rises regardless of price direction.
Tracking open interest, funding, exchange flows, SOPR, and NUPL together provides a consistent framework for identifying vulnerable zones in real time.
Chen said trader behavior remains remarkably consistent. Periods of low volatility trigger overconfidence. Liquidity gets mistaken for stability. Then volatility resets expectations and each cycle clears excess leverage.
The signals emerged 7-20 days before liquidation peaks in both cases. That gives attentive traders time to reduce exposure or position for the cascade. But most miss these warnings because they focus on price action alone.
Leverage concentration and weak spot participation matter more than price direction. Master those signals and you’ll spot the next billion-dollar cascade before it happens.