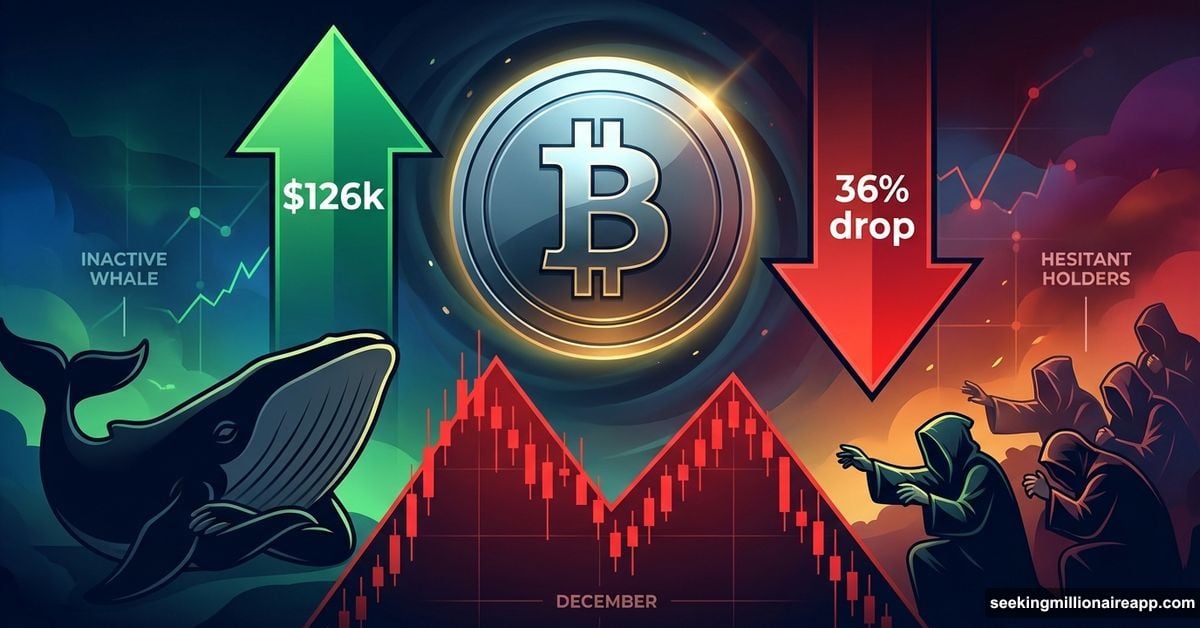
Bitcoin is stuck in limbo. Short-term holders just capitulated hard. That’s the same signal that marked the bottom in April 2025 before BTC surged to $126,000. But this time? The rally isn’t coming.
Here’s why. The groups that usually step in to absorb panic selling—whales and long-term holders—are sitting on their hands. Plus, the chart shows a bearish flag pattern pointing to a potential 36% drop. So 2026 could bring a new all-time high or a brutal breakdown. Let’s break down which outcome matters more.
December’s Red Candle Carries a Hidden Message
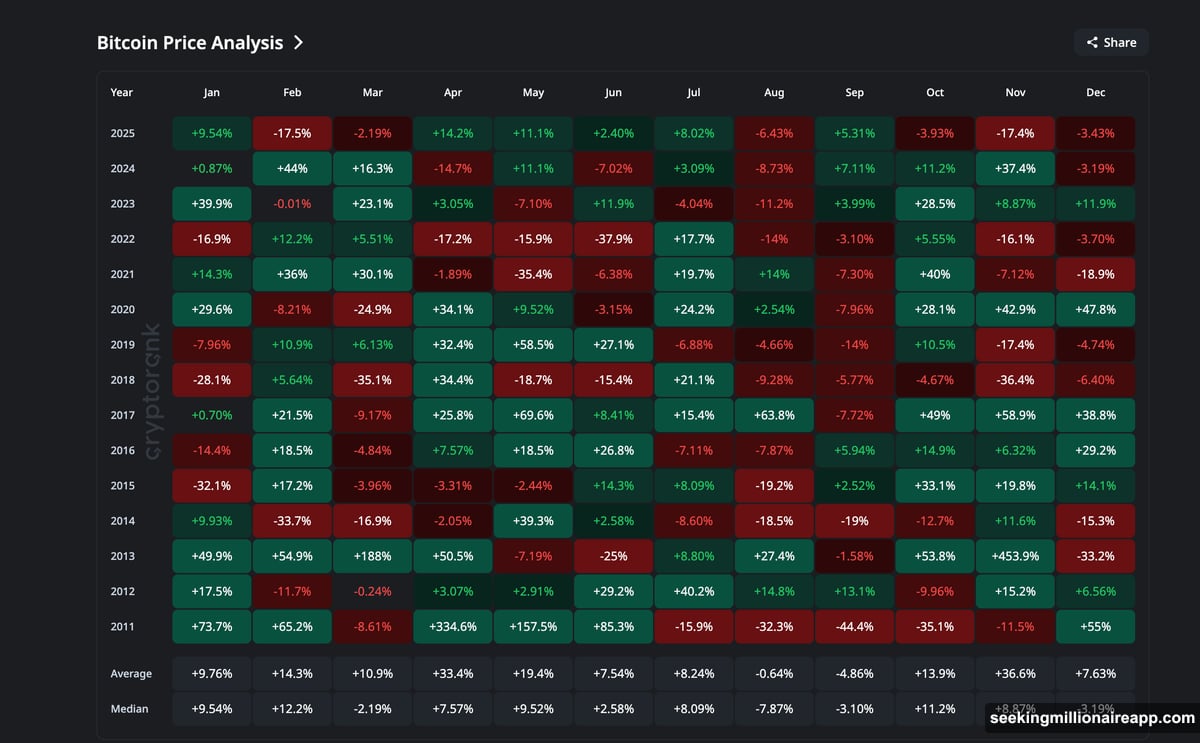
Bitcoin is closing December in the red again. That might sound bad. But it’s actually been a bullish signal since 2022.
Every time BTC ended December negative, January flipped green. That pattern helped kickstart the April 2025 rally that eventually pushed Bitcoin toward $126,000 by October.
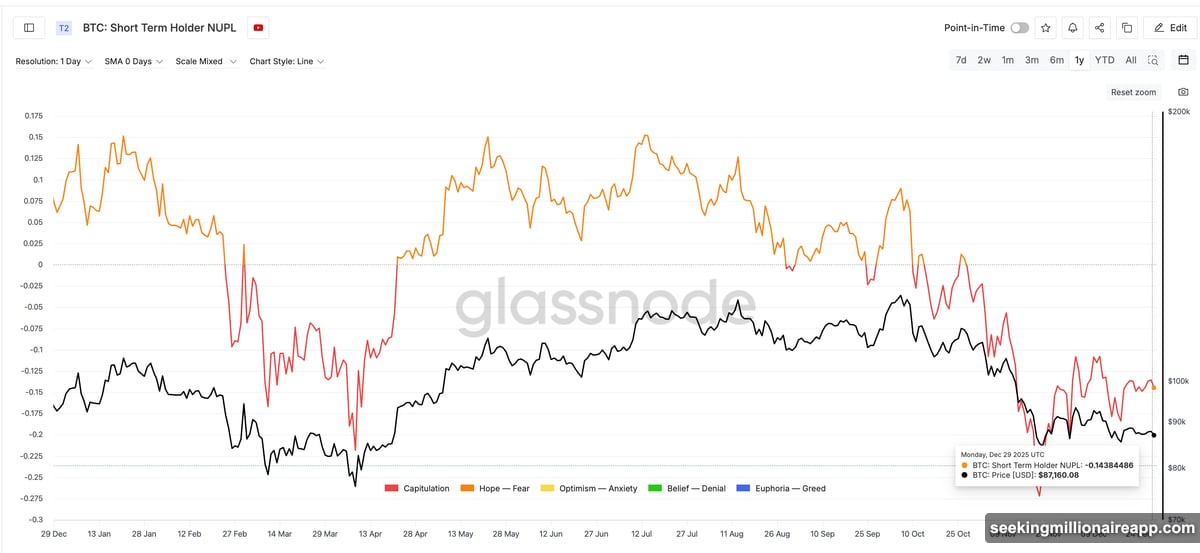
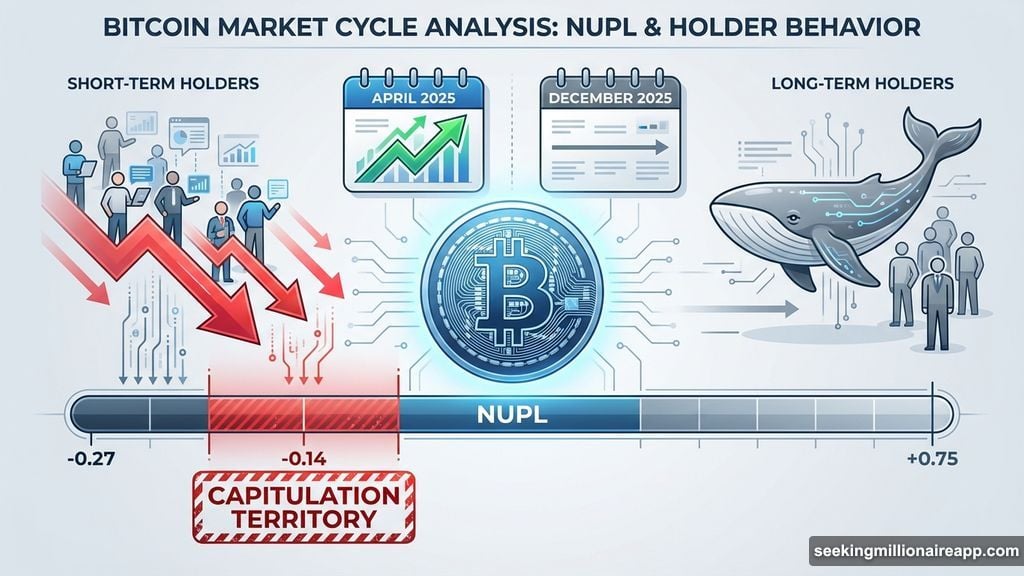
Right now, the same setup is appearing. Short-term holder NUPL (Net Unrealized Profit/Loss) sits in capitulation territory at −0.14. Back on November 21, it hit −0.27, even deeper than the April bottom at −0.27.
This metric tracks profit and loss sentiment for recent buyers. When it drops this low, it signals panic selling from newer holders. Historically, that’s when smart money steps in to buy the dip.
But here’s the catch. The bottom signal exists. The buying response does not.
Hunter Rogers, co-founder of TeraHash, told BeInCrypto why this metric matters: “As long as long-term holders stay firm, the cycle survives.” So the question isn’t whether capitulation happened. It’s whether the right buyers are showing up to absorb it.
They’re not. And that changes everything for 2026.
Long-Term Holders Are Buying, But Not Enough
Long-term holders (LTHs) usually save the day during capitulation events. They absorb supply, stabilize price, and set up the next leg higher. That’s exactly what happened in April 2025.
Back then, LTH net accumulation peaked at 22,237 BTC in a single day. They kept buying throughout the dip. That cushion allowed Bitcoin to recover and eventually rally to $126,000.
This time? The buying is there, but it’s weak. Since October 1, long-term holders were net sellers. They finally stopped. But recent accumulation only hit 4,862 BTC at its peak in December. Most days hover closer to 3,500 BTC.
That’s barely 20% of the April strength. So the signal has improved. But it’s not strong enough to flip the market by itself.
Rogers explained the stakes: “Long-term holder stability supports outcomes where Bitcoin remains in a reset phase and potentially works higher over time.” The stability exists. The aggression does not.
Without aggressive buying, rallies stall. And that brings us to the bigger problem: whales are missing in action.
Whales Refuse to Show Up
Whales are the shock absorbers of Bitcoin markets. They step in during weakness, absorb supply, and prevent cascading selloffs. That’s what they did into the April bottom and throughout July 2025.
Right now? They’re gone. Whale wallet counts holding 10,000–100,000 BTC remain at yearly lows. These wallets were rising into the April bottom. Today, the trend is flat or declining.
Rogers highlighted this disconnect: “Retail still has a late reaction, while whales tend to absorb all the supply during weakness. This pattern keeps playing out again and again.” Except it’s not playing out now.
The lack of whale absorption creates a gap in demand. That gap is why the November capitulation didn’t ignite the price like April did. Whales are not acting as the safety net yet. So the market stays vulnerable to breakdown pressure instead of breakout momentum.
Rogers warned this has direct implications for bullish targets: “Can Bitcoin go above $150,000 in 2026? Possibly. But it requires patience, liquidity, broader institutional adoption, and time.”
He also pushed back on aggressive forecasts: “Various scenarios of Bitcoin reaching $250,000 or more this year aren’t realistic to me at this point.” That contradicts predictions from analysts like Tom Lee, who sees Bitcoin hitting $200,000 in 2026.
But why are whales and long-term holders not stepping in? The answer sits on the chart.
The Bear Flag Pattern That’s Scaring Big Money
On the three-day chart, Bitcoin is forming what looks like a bear flag. This pattern typically signals continuation to the downside. The measured move suggests a potential 36% drop from current levels.
That’s not the only warning sign. Two bearish EMA crossovers are forming. EMAs (exponential moving averages) react faster to price changes than simple moving averages. The 50-period EMA is closing in on the 100-period EMA. The 20-period EMA is closing in on the 200-period EMA.
When both cross, it signals weakness. And this is happening while the flag pattern tests support near $86,420. That combination explains why whales are staying cautious. The chart is screaming risk, not opportunity.
Rogers confirmed this: “Bitcoin’s moves in 2026 will be decided more by behavior around cost and risk.” Right now, that behavior is stuck. Whales won’t commit. The price can’t leave this range.
So what would change the outlook?
Two Prices That Will Decide 2026
Bitcoin needs to reclaim $105,260 to invalidate the bear flag breakdown risk. Above that level, the previous peak near $126,000 becomes reachable again. Maybe even beatable.
Rogers explained: “The market already showed a peak near $126,000, yet this alone doesn’t end a cycle. What ends it is forced selling below the collective cost.” That collective cost sits near the realized price in the mid-$50,000s.
This is his line in the sand: “As long as the price stays firmly above the broad realized cost area around the mid-$50,000s, the market structure is stable.” A sustained drop under $58,000 would threaten the cycle structure. It could force long-term holders into losses and align with the lower bear flag target near $38,630.
So the path forward is simple:
- Above $105,260: Structure improves, rally toward $126,000+ becomes possible
- Below $58,000: Structure breaks, cycle ends, targets drop toward $38,000
That’s why $58,000 is the key level to watch. Break above resistance or fall through support. One of those moves will answer the market’s biggest question.
What Actually Happens Next
Bitcoin’s situation is direct. The bottom signal has appeared. The demand that usually follows has not. A bearish chart setup hangs over it.
Three things are clear:
- Short-term holders capitulated (bullish signal)
- Whales and long-term holders aren’t absorbing aggressively (bearish behavior)
- A bear flag breakdown looms (bearish structure)
A breakout above $105,000 changes the game. A breakdown under $83,300 confirms the downside risk. Either move will answer the question traders keep avoiding: Will 2026 bring a new Bitcoin all-time high or a fresh breakdown?
Rogers summed it up best: “Can Bitcoin reach $150,000 or higher in 2026? Possibly. But it requires patience, liquidity, and broader institutional adoption.” Right now, none of those pieces are in place.
So until whales and long-term holders start buying like they mean it, Bitcoin stays stuck between fear and greed. The chart shows the risk. On-chain data shows the hesitation. And the market waits for someone to make the first move.